 Violent
 Property
 Total
Total
Quick answer
According to crimebycity.com's analysis of FBI 2024 crime data, Dubuque, IA has a Safety Score of 45/100 — higher crime than 55% of US cities — with a total crime rate of 1,835.6 per 100,000 residents, ranking #1,623 of 2,971 US cities and #21 of 38 in Iowa.
Safety Score
Violent Crime Rate
Property Crime Rate
Is Dubuque, Iowa Safe?
Perched on the Mississippi River, Dubuque is Iowa's oldest city, boasting a rich industrial past. This Tri-State Area hub, with a population around 60,000, sits at the convergence of Iowa, Illinois, and Wisconsin.
Dubuque has a safety score of 45/100 (Higher Crime Than Average). Based on FBI data for 2024, the city reported a total crime rate of 1,835.6 per 100,000 residents, compared to the national average of 2,752.3 per 100,000.
Dubuque ranks #21 out of 38 cities in Iowa and #1623 out of 2971 nationally (safest first). This places it in the 45th percentile for safety — with higher crime than 55% of US cities.
The most elevated crime category in Dubuque is rape, at 80.2 per 100K — 1.8x the national average. Conversely, robbery is relatively low at just 0.3x the national rate.
Year over year, Dubuque's total crime rate decreased by 10.5%, with violent crime declining 6.2%.
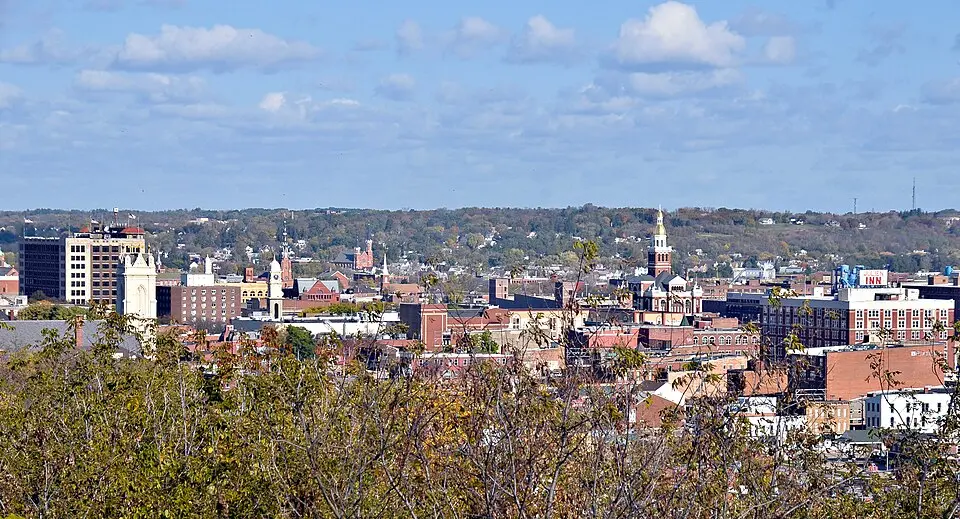
Photo: Wikimedia Commons
Dubuque Crime Statistics Breakdown (2024)
| Crime Type | Incidents | Rate per 100K | National Avg |
|---|---|---|---|
| Violent Crime | 235 | 400.9 | 473.3 |
| Murder | 1 | 1.7 | 6.2 |
| Rape | 47 | 80.2 | 43.4 |
| Robbery | 14 | 23.9 | 93.0 |
| Aggravated Assault | 173 | 295.1 | 330.0 |
| Property Crime | 841 | 1,434.7 | 2,279.1 |
| Burglary | 134 | 228.6 | 287.8 |
| Larceny-Theft | 652 | 1,112.3 | 1,638.9 |
| Motor Vehicle Theft | 55 | 93.8 | 352.4 |
| Arson | 0 | 0.0 | 0.0 |
Dubuque vs Iowa Average
How does Dubuque's crime rate compare to the Iowa state average?
| Metric | Dubuque | Iowa Avg | Difference |
|---|---|---|---|
| Violent Crime Rate | 400.9 | 350.8 | +14.3% |
| Property Crime Rate | 1,434.7 | 2,046.4 | -29.9% |
| Murder Rate | 1.7 | 2.5 | -31.9% |
| Total Crime Rate | 1,835.6 | 2,397.2 | -23.4% |
Dubuque Crime Rate Trends
Year-over-year crime rate changes for Dubuque, Iowa.
| Year | Coverage | Total Crime Rate | Violent Crime Rate | Property Crime Rate |
|---|---|---|---|---|
| 2024 | 58,620 | 1,835.6 | 400.9 | 1,434.7 |
| 2023 | 58,492 | 2,049.9 | 427.4 | 1,622.4 |
| 2022 | 58,676 | 2,268.4 | 461.9 | 1,806.5 |
| 2021 | 57,790 | 2,524.7 | 465.5 | 2,059.2 |
| 2020 | 57,904 | 2,538.7 | 428.3 | 2,110.4 |
| 2019 | 57,973 | 1,826.7 | 189.7 | 1,637.0 |
Frequently Asked Questions
Is Dubuque, Iowa safe?
Dubuque has a safety score of 45/100, meaning it has less crime than about 45% of US cities in our FBI dataset. With a total crime rate of 1,835.6 per 100,000 residents in 2024, Dubuque is higher-crime than most US cities.
What is the crime rate in Dubuque, Iowa?
According to FBI data for 2024, Dubuque has a violent crime rate of 400.9 per 100,000 and a property crime rate of 1,434.7 per 100,000 residents.
How does Dubuque compare to the national average?
Dubuque's total crime rate of 1,835.6 per 100,000 can be compared to the national average. The data covers 58,620 residents.
What types of crime are most common in Dubuque?
Based on FBI 2024 data, the most reported crimes in Dubuque include larceny-theft, aggravated assault, and burglary. Property crime is generally more common than violent crime.
Is Dubuque safe to visit?
Like any city, Dubuque has areas that are safer than others. The city's overall safety score is 45/100 based on FBI crime data. Standard travel precautions are recommended.