 Violent
Property
Total
Violent
Property
Total
Quick answer
According to crimebycity.com's analysis of FBI 2024 crime data, Ottumwa, IA has a Safety Score of 19/100 — higher crime than 81% of US cities — with a total crime rate of 3,013.7 per 100,000 residents, ranking #2,398 of 2,971 US cities and #33 of 38 in Iowa.
Safety Score
Violent Crime Rate
Property Crime Rate
Is Ottumwa, Iowa Safe?
Ottumwa, once a prominent coal mining center and home to the Beach Ottumwa water park, is a city in Wapello County, Iowa, situated along the Des Moines River. Its population was around 25,000 residents in 2020.
Ottumwa has a safety score of 19/100 (High Crime). Based on FBI data for 2024, the city reported a total crime rate of 3,013.7 per 100,000 residents, compared to the national average of 2,752.3 per 100,000.
Ottumwa ranks #33 out of 38 cities in Iowa and #2398 out of 2971 nationally (safest first). This places it in the 19th percentile for safety — with higher crime than 81% of US cities.
The most elevated crime category in Ottumwa is rape, at 83.4 per 100K — 1.9x the national average. Conversely, robbery is relatively low at just 0.3x the national rate.
Year over year, Ottumwa's total crime rate decreased by 12.5%, with violent crime declining 1.6%.
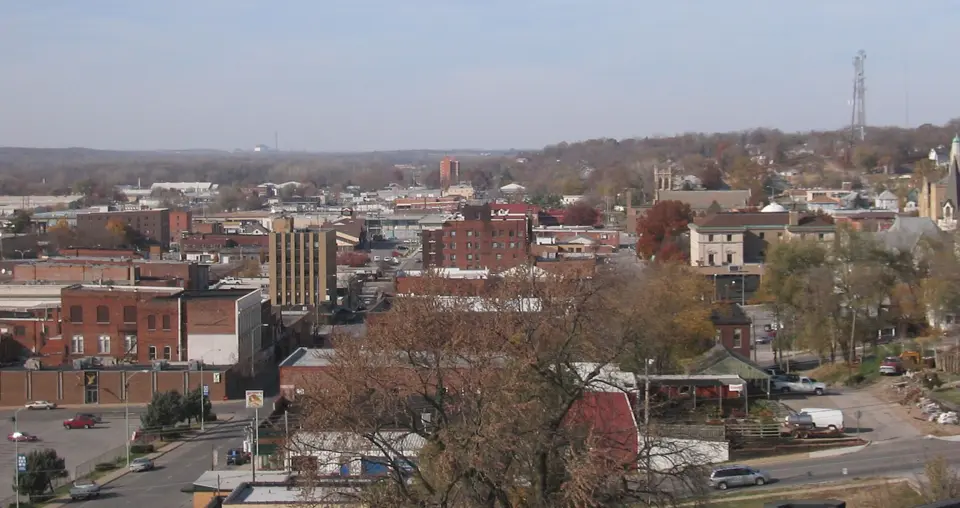
Photo: Wikimedia Commons
Ottumwa Crime Statistics Breakdown (2024)
| Crime Type | Incidents | Rate per 100K | National Avg |
|---|---|---|---|
| Violent Crime | 100 | 397.1 | 473.3 |
| Murder | 2 | 7.9 | 6.2 |
| Rape | 21 | 83.4 | 43.4 |
| Robbery | 7 | 27.8 | 93.0 |
| Aggravated Assault | 70 | 277.9 | 330.0 |
| Property Crime | 659 | 2,616.6 | 2,279.1 |
| Burglary | 108 | 428.8 | 287.8 |
| Larceny-Theft | 490 | 1,945.6 | 1,638.9 |
| Motor Vehicle Theft | 61 | 242.2 | 352.4 |
| Arson | 0 | 0.0 | 0.0 |
Ottumwa vs Iowa Average
How does Ottumwa's crime rate compare to the Iowa state average?
| Metric | Ottumwa | Iowa Avg | Difference |
|---|---|---|---|
| Violent Crime Rate | 397.1 | 350.8 | +13.2% |
| Property Crime Rate | 2,616.6 | 2,046.4 | +27.9% |
| Murder Rate | 7.9 | 2.5 | +216.3% |
| Total Crime Rate | 3,013.7 | 2,397.2 | +25.7% |
Ottumwa Crime Rate Trends
Year-over-year crime rate changes for Ottumwa, Iowa.
| Year | Coverage | Total Crime Rate | Violent Crime Rate | Property Crime Rate |
|---|---|---|---|---|
| 2024 | 25,185 | 3,013.7 | 397.1 | 2,616.6 |
| 2023 | 25,040 | 3,442.5 | 403.4 | 3,039.1 |
| 2022 | 25,249 | 4,451.7 | 776.3 | 3,675.4 |
| 2021 | 24,308 | 4,126.2 | 872.1 | 3,254.1 |
| 2020 | 24,293 | 4,964.4 | 983.8 | 3,980.6 |
| 2019 | 24,488 | 4,667.6 | 547.2 | 4,120.4 |
Frequently Asked Questions
Is Ottumwa, Iowa safe?
Ottumwa has a safety score of 19/100, meaning it has less crime than about 19% of US cities in our FBI dataset. With a total crime rate of 3,013.7 per 100,000 residents in 2024, Ottumwa is among the highest-crime US cities.
What is the crime rate in Ottumwa, Iowa?
According to FBI data for 2024, Ottumwa has a violent crime rate of 397.1 per 100,000 and a property crime rate of 2,616.6 per 100,000 residents.
How does Ottumwa compare to the national average?
Ottumwa's total crime rate of 3,013.7 per 100,000 can be compared to the national average. The data covers 25,185 residents.
What types of crime are most common in Ottumwa?
Based on FBI 2024 data, the most reported crimes in Ottumwa include larceny-theft, aggravated assault, and burglary. Property crime is generally more common than violent crime.
Is Ottumwa safe to visit?
Like any city, Ottumwa has areas that are safer than others. The city's overall safety score is 19/100 based on FBI crime data. Standard travel precautions are recommended.