 Violent
 Property
Total
Property
Total
Quick answer
According to crimebycity.com's analysis of FBI 2024 crime data, Hopkinsville, KY has a Safety Score of 20/100 — higher crime than 80% of US cities — with a total crime rate of 2,958.2 per 100,000 residents, ranking #2,374 of 2,971 US cities and #32 of 41 in Kentucky.
Safety Score
Violent Crime Rate
Property Crime Rate
Is Hopkinsville, Kentucky Safe?
Hopkinsville, Kentucky, home to the annual Little Green Men Festival, is a city of around 30,000 residents in Christian County, near the Tennessee border. It's a regional hub for agriculture and manufacturing.
Hopkinsville has a safety score of 20/100 (High Crime). Based on FBI data for 2024, the city reported a total crime rate of 2,958.2 per 100,000 residents, compared to the national average of 2,752.3 per 100,000.
Hopkinsville ranks #32 out of 41 cities in Kentucky and #2374 out of 2971 nationally (safest first). This places it in the 20th percentile for safety — with higher crime than 80% of US cities.
The most elevated crime category in Hopkinsville is burglary, at 511.5 per 100K — 1.8x the national average. Conversely, motor vehicle theft is relatively low at just 0.5x the national rate.
Year over year, Hopkinsville's total crime rate decreased by 15.3%, with violent crime rising 24.6%.
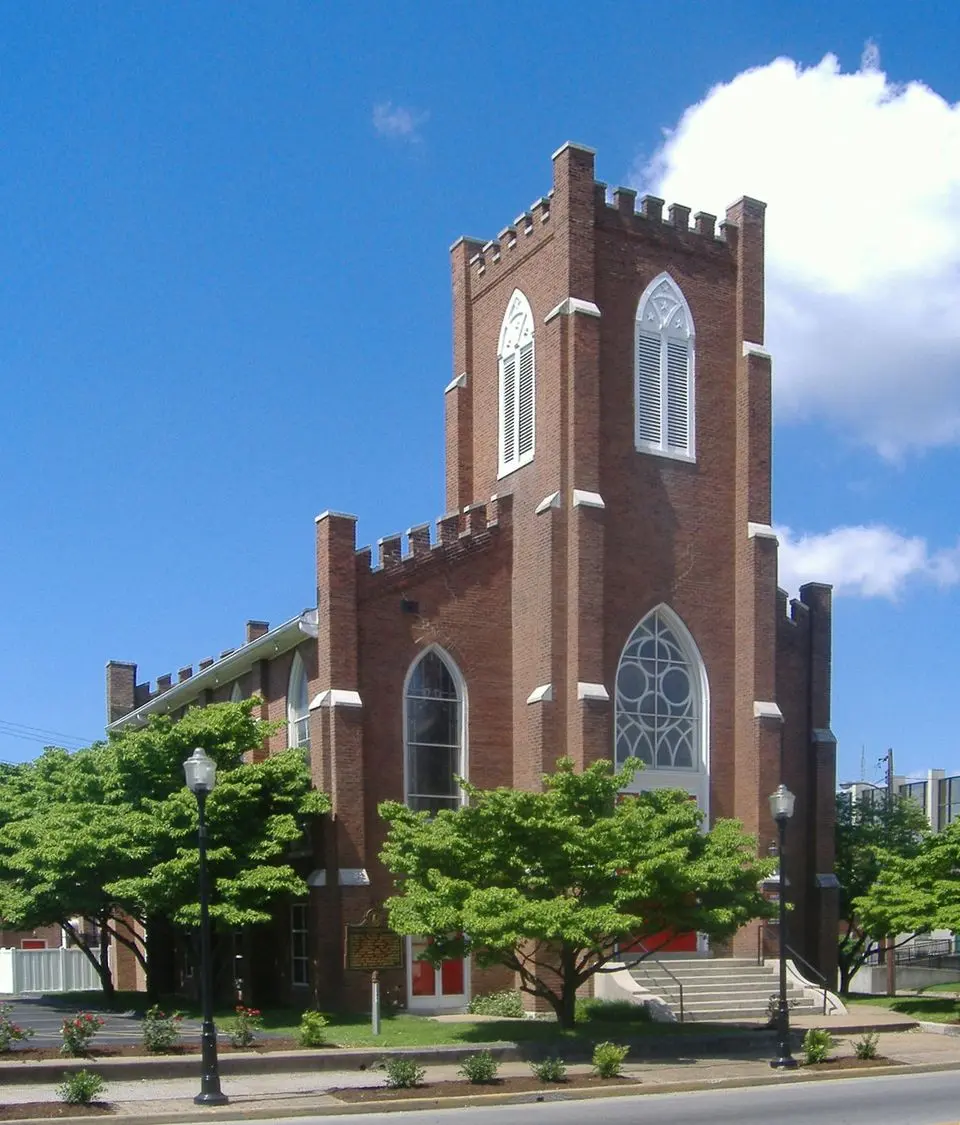
Photo: Wikimedia Commons
Hopkinsville Crime Statistics Breakdown (2024)
| Crime Type | Incidents | Rate per 100K | National Avg |
|---|---|---|---|
| Violent Crime | 139 | 452.9 | 473.3 |
| Murder | 2 | 6.5 | 6.2 |
| Rape | 20 | 65.2 | 43.4 |
| Robbery | 23 | 74.9 | 93.0 |
| Aggravated Assault | 92 | 299.7 | 330.0 |
| Property Crime | 769 | 2,505.4 | 2,279.1 |
| Burglary | 157 | 511.5 | 287.8 |
| Larceny-Theft | 553 | 1,801.7 | 1,638.9 |
| Motor Vehicle Theft | 59 | 192.2 | 352.4 |
| Arson | 0 | 0.0 | 0.0 |
Hopkinsville vs Kentucky Average
How does Hopkinsville's crime rate compare to the Kentucky state average?
| Metric | Hopkinsville | Kentucky Avg | Difference |
|---|---|---|---|
| Violent Crime Rate | 452.9 | 404.1 | +12.1% |
| Property Crime Rate | 2,505.4 | 2,468.7 | +1.5% |
| Murder Rate | 6.5 | 11.4 | -42.6% |
| Total Crime Rate | 2,958.2 | 2,872.7 | +3.0% |
Hopkinsville Crime Rate Trends
Year-over-year crime rate changes for Hopkinsville, Kentucky.
| Year | Coverage | Total Crime Rate | Violent Crime Rate | Property Crime Rate |
|---|---|---|---|---|
| 2024 | 30,694 | 2,958.2 | 452.9 | 2,505.4 |
| 2023 | 30,804 | 3,493.1 | 363.6 | 3,129.5 |
| 2022 | 30,528 | 4,107.7 | 380.0 | 3,727.7 |
| 2021 | 30,787 | 4,186.8 | 383.3 | 3,803.6 |
| 2020 | 30,532 | 3,376.8 | 304.6 | 3,072.2 |
| 2019 | 30,895 | 3,796.7 | 291.3 | 3,505.4 |
Frequently Asked Questions
Is Hopkinsville, Kentucky safe?
Hopkinsville has a safety score of 20/100, meaning it has less crime than about 20% of US cities in our FBI dataset. With a total crime rate of 2,958.2 per 100,000 residents in 2024, Hopkinsville is among the highest-crime US cities.
What is the crime rate in Hopkinsville, Kentucky?
According to FBI data for 2024, Hopkinsville has a violent crime rate of 452.9 per 100,000 and a property crime rate of 2,505.4 per 100,000 residents.
How does Hopkinsville compare to the national average?
Hopkinsville's total crime rate of 2,958.2 per 100,000 can be compared to the national average. The data covers 30,694 residents.
What types of crime are most common in Hopkinsville?
Based on FBI 2024 data, the most reported crimes in Hopkinsville include larceny-theft, aggravated assault, and burglary. Property crime is generally more common than violent crime.
Is Hopkinsville safe to visit?
Like any city, Hopkinsville has areas that are safer than others. The city's overall safety score is 20/100 based on FBI crime data. Standard travel precautions are recommended.