 Violent
 Property
 Total
Total
Quick answer
According to crimebycity.com's analysis of FBI 2024 crime data, Havre De Grace, MD has a Safety Score of 60/100 — safer than 60% of US cities — with a total crime rate of 1,404.1 per 100,000 residents, ranking #1,203 of 2,971 US cities and #2 of 22 in Maryland.
Safety Score
Violent Crime Rate
Property Crime Rate
Is Havre De Grace, Maryland Safe?
Havre de Grace, at the mouth of the Susquehanna River on the Chesapeake Bay, was once considered for the nation's capital. This Harford County city boasts a rich maritime heritage and a population under 15,000.
Havre De Grace has a safety score of 60/100 (Near National Average). Based on FBI data for 2024, the city reported a total crime rate of 1,404.1 per 100,000 residents, compared to the national average of 2,752.3 per 100,000.
Havre De Grace ranks #2 out of 22 cities in Maryland and #1203 out of 2971 nationally (safest first). This places it in the 60th percentile for safety — safer than 60% of US cities.
All major crime categories in Havre De Grace are below the national average, with murder particularly low at 0.0x the national rate.
Year over year, Havre De Grace's total crime rate decreased by 9.5%, with violent crime declining 22.3%.
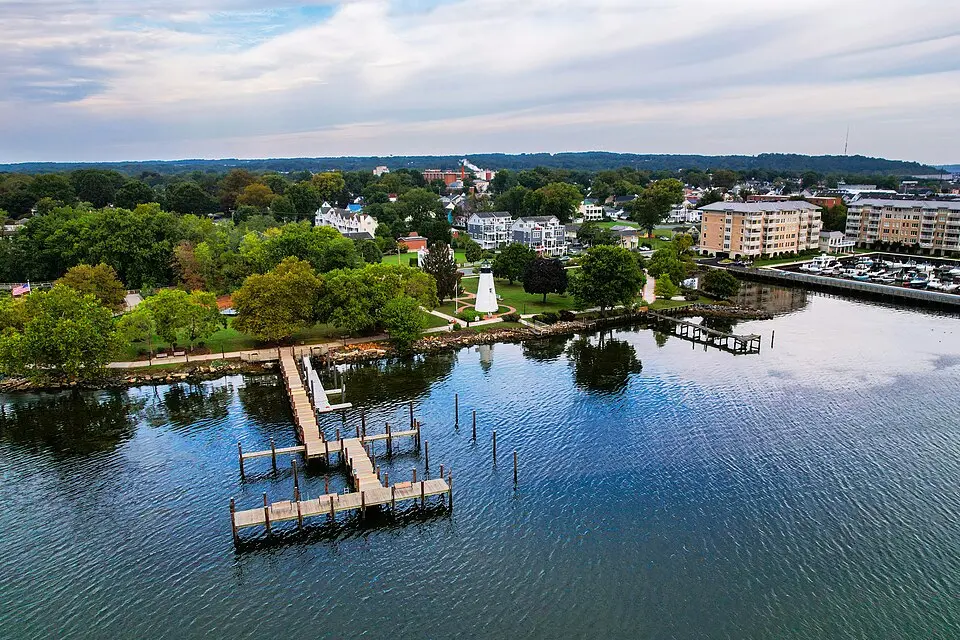
Photo: Wikimedia Commons
Havre De Grace Crime Statistics Breakdown (2024)
| Crime Type | Incidents | Rate per 100K | National Avg |
|---|---|---|---|
| Violent Crime | 21 | 139.1 | 473.3 |
| Murder | 0 | 0.0 | 6.2 |
| Rape | 3 | 19.9 | 43.4 |
| Robbery | 5 | 33.1 | 93.0 |
| Aggravated Assault | 13 | 86.1 | 330.0 |
| Property Crime | 191 | 1,265.0 | 2,279.1 |
| Burglary | 20 | 132.5 | 287.8 |
| Larceny-Theft | 160 | 1,059.7 | 1,638.9 |
| Motor Vehicle Theft | 11 | 72.9 | 352.4 |
| Arson | 0 | 0.0 | 0.0 |
Havre De Grace vs Maryland Average
How does Havre De Grace's crime rate compare to the Maryland state average?
| Metric | Havre De Grace | Maryland Avg | Difference |
|---|---|---|---|
| Violent Crime Rate | 139.1 | 985.4 | -85.9% |
| Property Crime Rate | 1,265.0 | 3,177.6 | -60.2% |
| Murder Rate | 0.0 | 18.2 | -100.0% |
| Total Crime Rate | 1,404.1 | 4,163.0 | -66.3% |
Havre De Grace Crime Rate Trends
Year-over-year crime rate changes for Havre De Grace, Maryland.
| Year | Coverage | Total Crime Rate | Violent Crime Rate | Property Crime Rate |
|---|---|---|---|---|
| 2024 | 15,099 | 1,404.1 | 139.1 | 1,265.0 |
| 2023 | 15,078 | 1,551.9 | 179.1 | 1,372.9 |
| 2022 | 14,883 | 1,525.2 | 127.7 | 1,397.6 |
| 2020 | 14,132 | 1,287.9 | 106.1 | 1,181.7 |
| 2019 | 13,890 | 1,447.1 | 259.2 | 1,187.9 |
Frequently Asked Questions
Is Havre De Grace, Maryland safe?
Havre De Grace has a safety score of 60/100, meaning it has less crime than about 60% of US cities in our FBI dataset. With a total crime rate of 1,404.1 per 100,000 residents in 2024, Havre De Grace is about average for a US city.
What is the crime rate in Havre De Grace, Maryland?
According to FBI data for 2024, Havre De Grace has a violent crime rate of 139.1 per 100,000 and a property crime rate of 1,265.0 per 100,000 residents.
How does Havre De Grace compare to the national average?
Havre De Grace's total crime rate of 1,404.1 per 100,000 can be compared to the national average. The data covers 15,099 residents.
What types of crime are most common in Havre De Grace?
Based on FBI 2024 data, the most reported crimes in Havre De Grace include larceny-theft, aggravated assault, and burglary. Property crime is generally more common than violent crime.
Is Havre De Grace safe to visit?
Like any city, Havre De Grace has areas that are safer than others. The city's overall safety score is 60/100 based on FBI crime data. Standard travel precautions are recommended.