 Violent
 Property
 Total
Total
Quick answer
According to crimebycity.com's analysis of FBI 2024 crime data, Claremont, NH has a Safety Score of 39/100 — higher crime than 61% of US cities — with a total crime rate of 2,066.1 per 100,000 residents, ranking #1,825 of 2,971 US cities and #24 of 29 in New Hampshire.
Safety Score
Violent Crime Rate
Property Crime Rate
Is Claremont, New Hampshire Safe?
Claremont, New Hampshire, a former mill town on the Sugar River, boasts the state's oldest continuously operating opera house. This small city, home to around 13,000 residents, is nestled in the Upper Valley region near the Vermont border.
Claremont has a safety score of 39/100 (Higher Crime Than Average). Based on FBI data for 2024, the city reported a total crime rate of 2,066.1 per 100,000 residents, compared to the national average of 2,752.3 per 100,000.
Claremont ranks #24 out of 29 cities in New Hampshire and #1825 out of 2971 nationally (safest first). This places it in the 39th percentile for safety — with higher crime than 61% of US cities.
Year over year, Claremont's total crime rate decreased by 14.8%, with violent crime rising 18.1%.
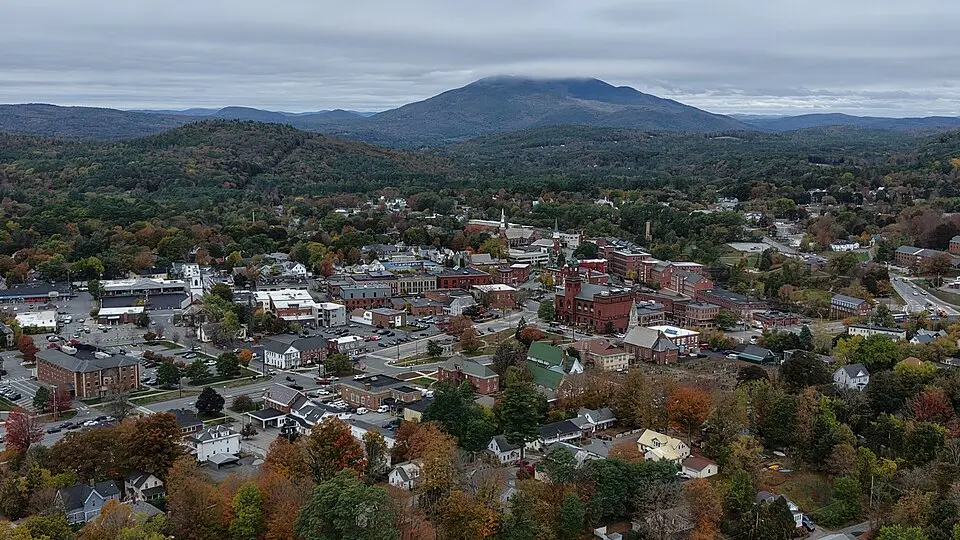
Photo: Wikimedia Commons
Claremont Crime Statistics Breakdown (2024)
| Crime Type | Incidents | Rate per 100K | National Avg |
|---|---|---|---|
| Violent Crime | 26 | 197.5 | 473.3 |
| Murder | 0 | 0.0 | 6.2 |
| Rape | 4 | 30.4 | 43.4 |
| Robbery | 5 | 38.0 | 93.0 |
| Aggravated Assault | 16 | 121.5 | 330.0 |
| Property Crime | 246 | 1,868.6 | 2,279.1 |
| Burglary | 20 | 151.9 | 287.8 |
| Larceny-Theft | 209 | 1,587.5 | 1,638.9 |
| Motor Vehicle Theft | 17 | 129.1 | 352.4 |
| Arson | 0 | 0.0 | 0.0 |
Claremont vs New Hampshire Average
How does Claremont's crime rate compare to the New Hampshire state average?
| Metric | Claremont | New Hampshire Avg | Difference |
|---|---|---|---|
| Violent Crime Rate | 197.5 | 133.2 | +48.3% |
| Property Crime Rate | 1,868.6 | 1,158.9 | +61.2% |
| Murder Rate | 0.0 | 1.2 | -100.0% |
| Total Crime Rate | 2,066.1 | 1,292.0 | +59.9% |
Claremont Crime Rate Trends
Year-over-year crime rate changes for Claremont, New Hampshire.
| Year | Coverage | Total Crime Rate | Violent Crime Rate | Property Crime Rate |
|---|---|---|---|---|
| 2024 | 13,165 | 2,066.1 | 197.5 | 1,868.6 |
| 2022 | 13,153 | 2,425.3 | 167.3 | 2,258.0 |
| 2021 | 12,905 | 2,518.4 | 100.7 | 2,417.7 |
| 2020 | 12,887 | 2,157.2 | 108.6 | 2,048.6 |
Frequently Asked Questions
Is Claremont, New Hampshire safe?
Claremont has a safety score of 39/100, meaning it has less crime than about 39% of US cities in our FBI dataset. With a total crime rate of 2,066.1 per 100,000 residents in 2024, Claremont is higher-crime than most US cities.
What is the crime rate in Claremont, New Hampshire?
According to FBI data for 2024, Claremont has a violent crime rate of 197.5 per 100,000 and a property crime rate of 1,868.6 per 100,000 residents.
How does Claremont compare to the national average?
Claremont's total crime rate of 2,066.1 per 100,000 can be compared to the national average. The data covers 13,165 residents.
What types of crime are most common in Claremont?
Based on FBI 2024 data, the most reported crimes in Claremont include larceny-theft, aggravated assault, and burglary. Property crime is generally more common than violent crime.
Is Claremont safe to visit?
Like any city, Claremont has areas that are safer than others. The city's overall safety score is 39/100 based on FBI crime data. Standard travel precautions are recommended.