 Violent
Property
Total
Violent
Property
Total
Quick answer
According to crimebycity.com's analysis of FBI 2024 crime data, Sapulpa, OK has a Safety Score of 53/100 — safer than 53% of US cities — with a total crime rate of 1,582.2 per 100,000 residents, ranking #1,384 of 2,971 US cities and #15 of 45 in Oklahoma.
Safety Score
Violent Crime Rate
Property Crime Rate
Is Sapulpa, Oklahoma Safe?
Sapulpa, Oklahoma, a city bisected by Route 66, was once a thriving railroad town and is now home to the Waite Phillips filling station museum. Located southwest of Tulsa, it has a population of around 22,000 residents.
Sapulpa has a safety score of 53/100 (Near National Average). Based on FBI data for 2024, the city reported a total crime rate of 1,582.2 per 100,000 residents, compared to the national average of 2,752.3 per 100,000.
Sapulpa ranks #15 out of 45 cities in Oklahoma and #1384 out of 2971 nationally (safest first). This places it in the 53rd percentile for safety — safer than 53% of US cities.
Year over year, Sapulpa's total crime rate decreased by 11.5%, with violent crime declining 8.1%.
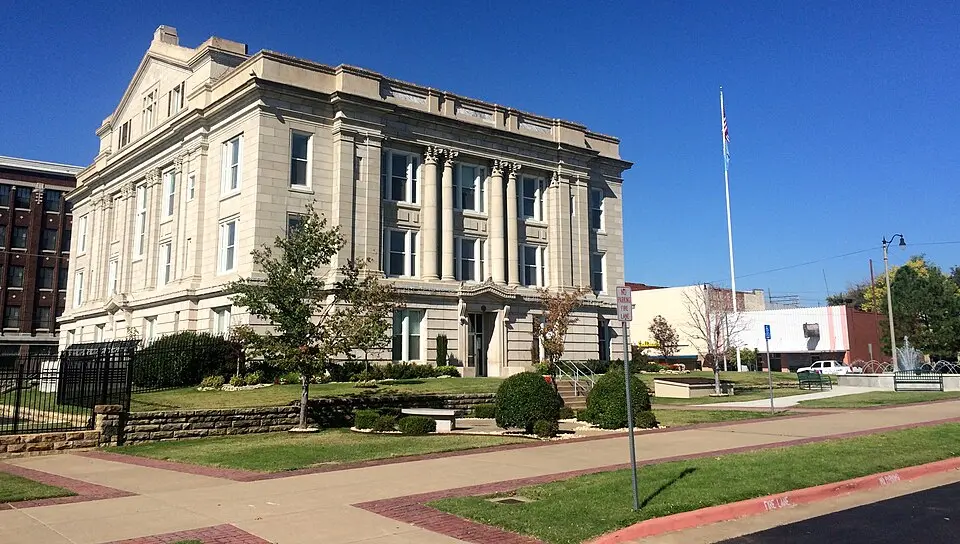
Photo: Wikimedia Commons
Sapulpa Crime Statistics Breakdown (2024)
| Crime Type | Incidents | Rate per 100K | National Avg |
|---|---|---|---|
| Violent Crime | 44 | 188.7 | 473.3 |
| Murder | 1 | 4.3 | 6.2 |
| Rape | 6 | 25.7 | 43.4 |
| Robbery | 4 | 17.2 | 93.0 |
| Aggravated Assault | 32 | 137.2 | 330.0 |
| Property Crime | 325 | 1,393.5 | 2,279.1 |
| Burglary | 64 | 274.4 | 287.8 |
| Larceny-Theft | 239 | 1,024.8 | 1,638.9 |
| Motor Vehicle Theft | 22 | 94.3 | 352.4 |
| Arson | 0 | 0.0 | 0.0 |
Sapulpa vs Oklahoma Average
How does Sapulpa's crime rate compare to the Oklahoma state average?
| Metric | Sapulpa | Oklahoma Avg | Difference |
|---|---|---|---|
| Violent Crime Rate | 188.7 | 533.0 | -64.6% |
| Property Crime Rate | 1,393.5 | 2,450.4 | -43.1% |
| Murder Rate | 4.3 | 6.5 | -33.9% |
| Total Crime Rate | 1,582.2 | 2,983.5 | -47.0% |
Sapulpa Crime Rate Trends
Year-over-year crime rate changes for Sapulpa, Oklahoma.
| Year | Coverage | Total Crime Rate | Violent Crime Rate | Property Crime Rate |
|---|---|---|---|---|
| 2024 | 23,322 | 1,582.2 | 188.7 | 1,393.5 |
| 2023 | 22,882 | 1,787.4 | 205.4 | 1,582.0 |
| 2022 | 22,447 | 1,884.4 | 249.5 | 1,635.0 |
| 2021 | 21,535 | 2,665.4 | 376.1 | 2,289.3 |
| 2020 | 21,394 | 2,397.9 | 266.4 | 2,131.4 |
| 2019 | 20,888 | 2,886.8 | 277.7 | 2,609.2 |
Frequently Asked Questions
Is Sapulpa, Oklahoma safe?
Sapulpa has a safety score of 53/100, meaning it has less crime than about 53% of US cities in our FBI dataset. With a total crime rate of 1,582.2 per 100,000 residents in 2024, Sapulpa is about average for a US city.
What is the crime rate in Sapulpa, Oklahoma?
According to FBI data for 2024, Sapulpa has a violent crime rate of 188.7 per 100,000 and a property crime rate of 1,393.5 per 100,000 residents.
How does Sapulpa compare to the national average?
Sapulpa's total crime rate of 1,582.2 per 100,000 can be compared to the national average. The data covers 23,322 residents.
What types of crime are most common in Sapulpa?
Based on FBI 2024 data, the most reported crimes in Sapulpa include larceny-theft, aggravated assault, and burglary. Property crime is generally more common than violent crime.
Is Sapulpa safe to visit?
Like any city, Sapulpa has areas that are safer than others. The city's overall safety score is 53/100 based on FBI crime data. Standard travel precautions are recommended.