 Violent
Property
Total
Violent
Property
Total
Quick answer
According to crimebycity.com's analysis of FBI 2024 crime data, West Linn, OR has a Safety Score of 80/100 — safer than 80% of US cities — with a total crime rate of 833.9 per 100,000 residents, ranking #591 of 2,971 US cities and #3 of 48 in Oregon.
Safety Score
Violent Crime Rate
Property Crime Rate
Is West Linn, Oregon Safe?
West Linn, Oregon, a affluent suburb south of Portland, is known for its scenic views overlooking the Willamette and Tualatin Rivers. The city's history includes the operation of Oregon's first paper mill, established in the late 19th century.
West Linn has a safety score of 80/100 (Safer Than Average). Based on FBI data for 2024, the city reported a total crime rate of 833.9 per 100,000 residents, compared to the national average of 2,752.3 per 100,000.
West Linn ranks #3 out of 48 cities in Oregon and #591 out of 2971 nationally (safest first). This places it in the 80th percentile for safety — safer than 80% of US cities.
All major crime categories in West Linn are below the national average, with murder particularly low at 0.0x the national rate.
Year over year, West Linn's total crime rate decreased by 26%, with violent crime rising 8.5%.
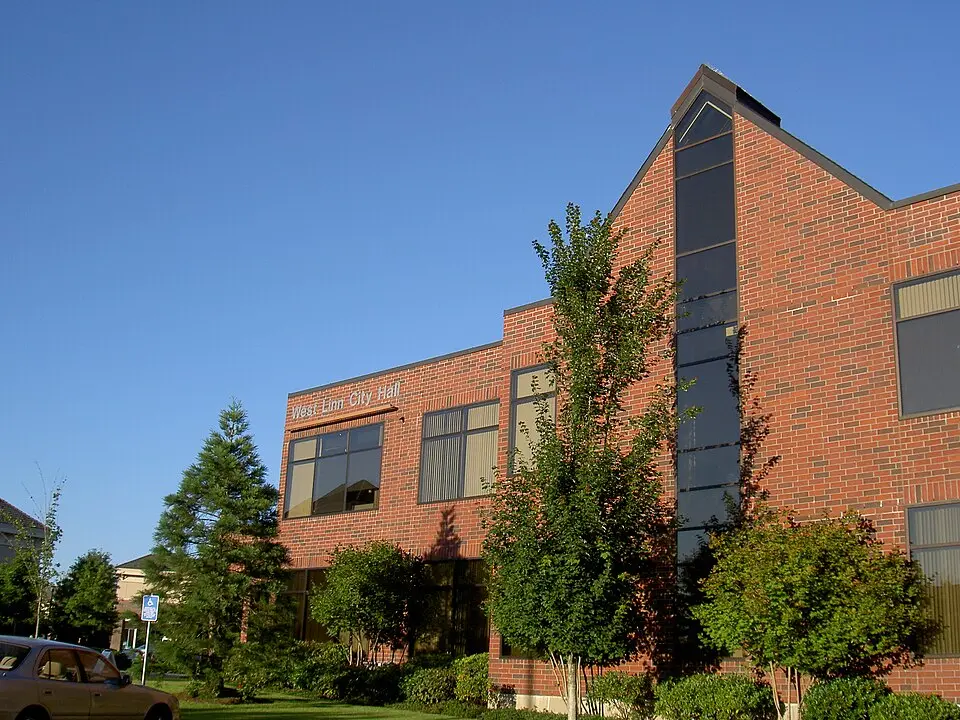
Photo: Wikimedia Commons
West Linn Crime Statistics Breakdown (2024)
| Crime Type | Incidents | Rate per 100K | National Avg |
|---|---|---|---|
| Violent Crime | 15 | 56.9 | 473.3 |
| Murder | 0 | 0.0 | 6.2 |
| Rape | 3 | 11.4 | 43.4 |
| Robbery | 2 | 7.6 | 93.0 |
| Aggravated Assault | 10 | 37.9 | 330.0 |
| Property Crime | 205 | 777.0 | 2,279.1 |
| Burglary | 26 | 98.6 | 287.8 |
| Larceny-Theft | 167 | 633.0 | 1,638.9 |
| Motor Vehicle Theft | 12 | 45.5 | 352.4 |
| Arson | 0 | 0.0 | 0.0 |
West Linn vs Oregon Average
How does West Linn's crime rate compare to the Oregon state average?
| Metric | West Linn | Oregon Avg | Difference |
|---|---|---|---|
| Violent Crime Rate | 56.9 | 302.2 | -81.2% |
| Property Crime Rate | 777.0 | 2,350.3 | -66.9% |
| Murder Rate | 0.0 | 2.3 | -100.0% |
| Total Crime Rate | 833.9 | 2,652.5 | -68.6% |
West Linn Crime Rate Trends
Year-over-year crime rate changes for West Linn, Oregon.
| Year | Coverage | Total Crime Rate | Violent Crime Rate | Property Crime Rate |
|---|---|---|---|---|
| 2024 | 26,382 | 833.9 | 56.9 | 777.0 |
| 2023 | 26,708 | 1,127.0 | 52.4 | 1,074.6 |
| 2022 | 26,842 | 1,158.6 | 82.0 | 1,076.7 |
| 2021 | 26,908 | 1,341.6 | 74.3 | 1,267.3 |
| 2020 | 26,916 | 1,218.6 | 52.0 | 1,166.6 |
| 2019 | 26,962 | 927.2 | 70.5 | 856.8 |
Frequently Asked Questions
Is West Linn, Oregon safe?
West Linn has a safety score of 80/100, meaning it has less crime than about 80% of US cities in our FBI dataset. With a total crime rate of 833.9 per 100,000 residents in 2024, West Linn is relatively safe.
What is the crime rate in West Linn, Oregon?
According to FBI data for 2024, West Linn has a violent crime rate of 56.9 per 100,000 and a property crime rate of 777.0 per 100,000 residents.
How does West Linn compare to the national average?
West Linn's total crime rate of 833.9 per 100,000 can be compared to the national average. The data covers 26,382 residents.
What types of crime are most common in West Linn?
Based on FBI 2024 data, the most reported crimes in West Linn include larceny-theft, aggravated assault, and burglary. Property crime is generally more common than violent crime.
Is West Linn safe to visit?
Like any city, West Linn has areas that are safer than others. The city's overall safety score is 80/100 based on FBI crime data. Standard travel precautions are recommended.