 Violent
 Property
Total
Property
Total
Quick answer
According to crimebycity.com's analysis of FBI 2024 crime data, North Providence, RI has a Safety Score of 84/100 — safer than 84% of US cities — with a total crime rate of 739.3 per 100,000 residents, ranking #487 of 2,971 US cities and #7 of 27 in Rhode Island.
Safety Score
Violent Crime Rate
Property Crime Rate
Is North Providence, Rhode Island Safe?
North Providence, a small town bordering Providence, is home to a diverse population. Historically known for its mills, it retains a distinct suburban character with a mix of residential areas and commercial strips.
North Providence has a safety score of 84/100 (Safer Than Average). Based on FBI data for 2024, the city reported a total crime rate of 739.3 per 100,000 residents, compared to the national average of 2,752.3 per 100,000.
North Providence ranks #7 out of 27 cities in Rhode Island and #487 out of 2971 nationally (safest first). This places it in the 84th percentile for safety — safer than 84% of US cities.
All major crime categories in North Providence are below the national average, with murder particularly low at 0.0x the national rate.
Year over year, North Providence's total crime rate decreased by 22.7%, with violent crime rising 10.9%.
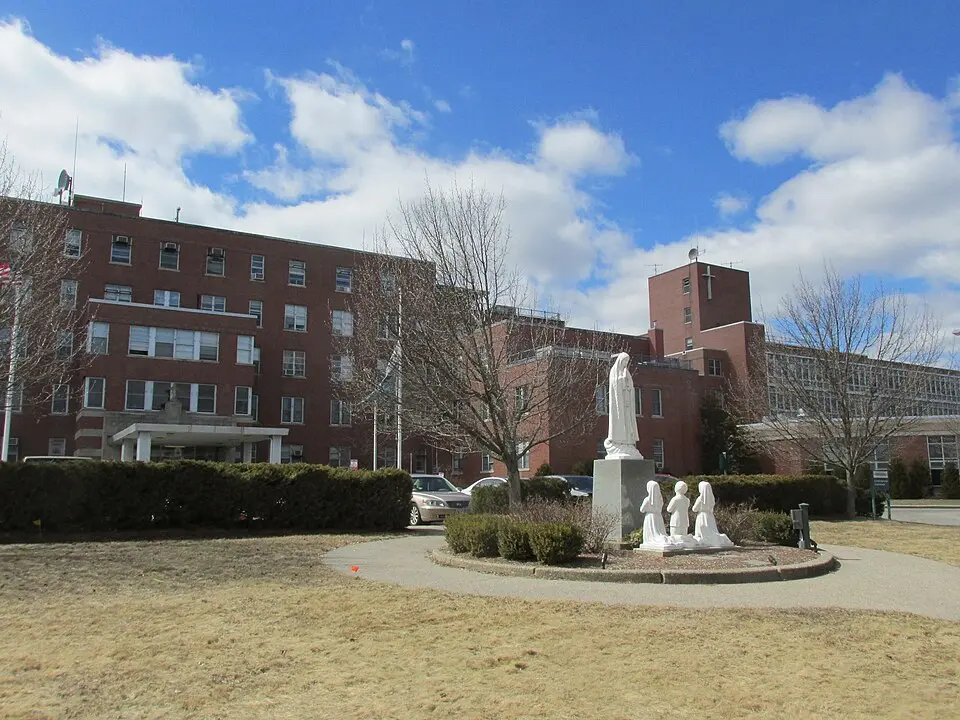
Photo: Wikimedia Commons
North Providence Crime Statistics Breakdown (2024)
| Crime Type | Incidents | Rate per 100K | National Avg |
|---|---|---|---|
| Violent Crime | 36 | 104.8 | 473.3 |
| Murder | 0 | 0.0 | 6.2 |
| Rape | 10 | 29.1 | 43.4 |
| Robbery | 5 | 14.6 | 93.0 |
| Aggravated Assault | 21 | 61.1 | 330.0 |
| Property Crime | 218 | 634.6 | 2,279.1 |
| Burglary | 15 | 43.7 | 287.8 |
| Larceny-Theft | 161 | 468.6 | 1,638.9 |
| Motor Vehicle Theft | 42 | 122.3 | 352.4 |
| Arson | 0 | 0.0 | 0.0 |
North Providence vs Rhode Island Average
How does North Providence's crime rate compare to the Rhode Island state average?
| Metric | North Providence | Rhode Island Avg | Difference |
|---|---|---|---|
| Violent Crime Rate | 104.8 | 158.2 | -33.8% |
| Property Crime Rate | 634.6 | 1,075.7 | -41.0% |
| Murder Rate | 0.0 | 2.1 | -100.0% |
| Total Crime Rate | 739.3 | 1,234.0 | -40.1% |
North Providence Crime Rate Trends
Year-over-year crime rate changes for North Providence, Rhode Island.
| Year | Coverage | Total Crime Rate | Violent Crime Rate | Property Crime Rate |
|---|---|---|---|---|
| 2024 | 34,355 | 739.3 | 104.8 | 634.6 |
| 2023 | 33,880 | 956.3 | 94.5 | 861.9 |
| 2022 | 33,809 | 1,058.9 | 115.4 | 943.5 |
| 2021 | 33,712 | 961.1 | 97.9 | 863.2 |
| 2020 | 32,652 | 747.3 | 156.2 | 591.1 |
| 2019 | 32,655 | 771.7 | 134.7 | 637.0 |
Frequently Asked Questions
Is North Providence, Rhode Island safe?
North Providence has a safety score of 84/100, meaning it has less crime than about 84% of US cities in our FBI dataset. With a total crime rate of 739.3 per 100,000 residents in 2024, North Providence is relatively safe.
What is the crime rate in North Providence, Rhode Island?
According to FBI data for 2024, North Providence has a violent crime rate of 104.8 per 100,000 and a property crime rate of 634.6 per 100,000 residents.
How does North Providence compare to the national average?
North Providence's total crime rate of 739.3 per 100,000 can be compared to the national average. The data covers 34,355 residents.
What types of crime are most common in North Providence?
Based on FBI 2024 data, the most reported crimes in North Providence include larceny-theft, aggravated assault, and burglary. Property crime is generally more common than violent crime.
Is North Providence safe to visit?
Like any city, North Providence has areas that are safer than others. The city's overall safety score is 84/100 based on FBI crime data. Standard travel precautions are recommended.