 Violent
Property
Total
Violent
Property
Total
Quick answer
According to crimebycity.com's analysis of FBI 2024 crime data, Rock Hill, SC has a Safety Score of 23/100 — higher crime than 77% of US cities — with a total crime rate of 2,790.4 per 100,000 residents, ranking #2,293 of 2,971 US cities and #21 of 40 in South Carolina.
Safety Score
Violent Crime Rate
Property Crime Rate
Is Rock Hill, South Carolina Safe?
Rock Hill, South Carolina, a city in York County, is known for its textile heritage and as the site of the first sit-ins of the modern Civil Rights Movement. Situated just south of Charlotte, North Carolina, it boasts a population reflecting a diverse mix of long-time residents and newcomers.
Rock Hill has a safety score of 23/100 (High Crime). Based on FBI data for 2024, the city reported a total crime rate of 2,790.4 per 100,000 residents, compared to the national average of 2,752.3 per 100,000.
Rock Hill ranks #21 out of 40 cities in South Carolina and #2293 out of 2971 nationally (safest first). This places it in the 23rd percentile for safety — with higher crime than 77% of US cities.
The most elevated crime category in Rock Hill is murder, at 11.9 per 100K — 1.9x the national average. Conversely, robbery is relatively low at just 0.4x the national rate.
Year over year, Rock Hill's total crime rate decreased by 12.4%, with violent crime declining 13.7%.
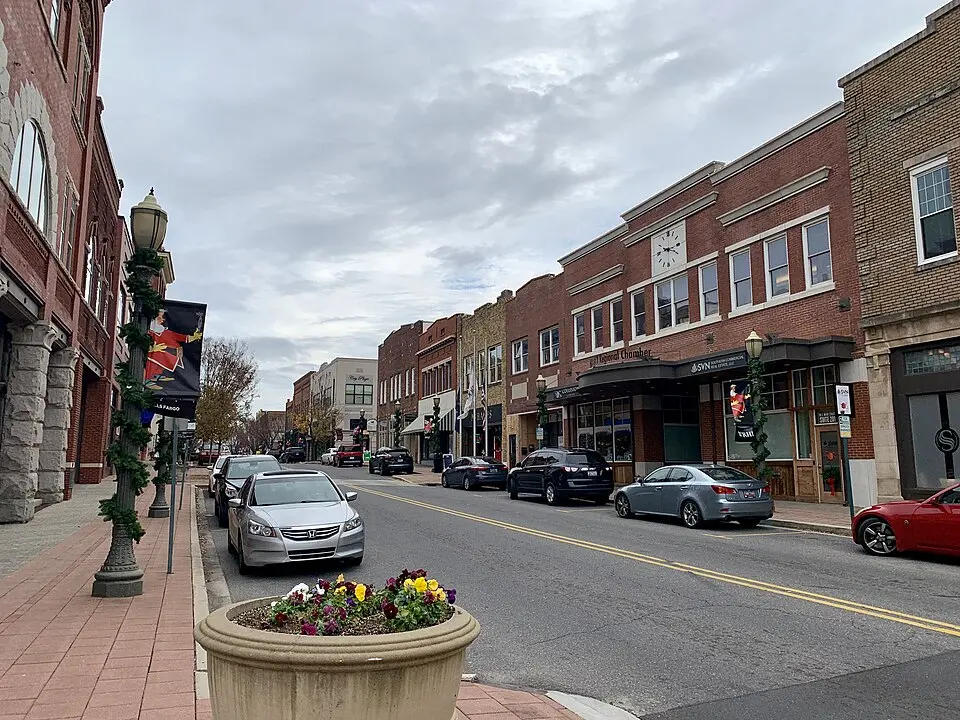
Photo: Wikimedia Commons
Rock Hill Crime Statistics Breakdown (2024)
| Crime Type | Incidents | Rate per 100K | National Avg |
|---|---|---|---|
| Violent Crime | 336 | 442.3 | 473.3 |
| Murder | 9 | 11.9 | 6.2 |
| Rape | 26 | 34.2 | 43.4 |
| Robbery | 30 | 39.5 | 93.0 |
| Aggravated Assault | 270 | 355.4 | 330.0 |
| Property Crime | 1,784 | 2,348.1 | 2,279.1 |
| Burglary | 209 | 275.1 | 287.8 |
| Larceny-Theft | 1,373 | 1,807.2 | 1,638.9 |
| Motor Vehicle Theft | 202 | 265.9 | 352.4 |
| Arson | 0 | 0.0 | 0.0 |
Rock Hill vs South Carolina Average
How does Rock Hill's crime rate compare to the South Carolina state average?
| Metric | Rock Hill | South Carolina Avg | Difference |
|---|---|---|---|
| Violent Crime Rate | 442.3 | 493.6 | -10.4% |
| Property Crime Rate | 2,348.1 | 2,669.0 | -12.0% |
| Murder Rate | 11.9 | 8.0 | +47.4% |
| Total Crime Rate | 2,790.4 | 3,162.7 | -11.8% |
Rock Hill Crime Rate Trends
Year-over-year crime rate changes for Rock Hill, South Carolina.
| Year | Coverage | Total Crime Rate | Violent Crime Rate | Property Crime Rate |
|---|---|---|---|---|
| 2024 | 75,975 | 2,790.4 | 442.3 | 2,348.1 |
| 2023 | 75,681 | 3,185.7 | 512.7 | 2,673.1 |
| 2022 | 74,047 | 3,207.4 | 491.6 | 2,715.8 |
| 2021 | 77,334 | 3,046.5 | 620.7 | 2,425.8 |
| 2020 | 76,016 | 3,567.7 | 701.2 | 2,866.5 |
| 2019 | 75,342 | 4,007.1 | 661.0 | 3,346.1 |
Frequently Asked Questions
Is Rock Hill, South Carolina safe?
Rock Hill has a safety score of 23/100, meaning it has less crime than about 23% of US cities in our FBI dataset. With a total crime rate of 2,790.4 per 100,000 residents in 2024, Rock Hill is among the highest-crime US cities.
What is the crime rate in Rock Hill, South Carolina?
According to FBI data for 2024, Rock Hill has a violent crime rate of 442.3 per 100,000 and a property crime rate of 2,348.1 per 100,000 residents.
How does Rock Hill compare to the national average?
Rock Hill's total crime rate of 2,790.4 per 100,000 can be compared to the national average. The data covers 75,975 residents.
What types of crime are most common in Rock Hill?
Based on FBI 2024 data, the most reported crimes in Rock Hill include larceny-theft, aggravated assault, and burglary. Property crime is generally more common than violent crime.
Is Rock Hill safe to visit?
Like any city, Rock Hill has areas that are safer than others. The city's overall safety score is 23/100 based on FBI crime data. Standard travel precautions are recommended.