Moving from Bellevue, NE to Warwick, RI?
An out-of-state move adds a new driver's license, plates, voter registration and state-specific deadlines. The Moving Checklist Planner dates every task from your move-in day — seven tabs for Google Sheets or Excel, $12 once.
Is Bellevue, NE or Warwick, RI Safer?
According to crimebycity.com's analysis of FBI data, Warwick, RI is safer than Bellevue, NE (Safety Score 66/100 vs 66/100), with a total crime rate of 1,227 per 100,000 versus 1,231 for Bellevue, NE — 0% lower. Bellevue has lower rates in 4 of 7 crime categories.
The biggest difference is in murder, where Bellevue has a 100% lower rate.
Quiz: which of these is MORE DANGEROUS than Bellevue, NE?
Bellevue — 5-Year Trend
 Violent
Property
Total
Warwick — 5-Year Trend
Violent
Property
Total
Bellevue, NE

Warwick, RI
Detailed Crime Rate Comparison
| Crime Type | Bellevue | Warwick | Difference |
|---|---|---|---|
| Total Crime Rate | 1,231.3 | 1,226.6 | +4.7 |
| Violent Crime Rate | 99.2 | 79.5 | +19.7 |
| Murder Rate | 0.0 | 2.4 | -2.4 |
| Rape Rate | 72.4 | 17.8 | +54.6 |
| Robbery Rate | 11.0 | 9.5 | +1.5 |
| Aggravated Assault Rate | 15.8 | 49.8 | -34.1 |
| Property Crime Rate | 1,132.1 | 1,147.1 | -15.0 |
| Burglary Rate | 97.6 | 100.8 | -3.2 |
| Larceny-Theft Rate | 910.1 | 962.1 | -52.0 |
| Motor Vehicle Theft Rate | 124.4 | 84.2 | +40.2 |
All rates per 100,000 residents. Source: FBI UCR.
Moving from Bellevue, NE to Warwick, RI?
An out-of-state move adds new driver's license, plates, voter registration and deadlines that differ by state. The Moving Checklist Planner dates every task from your move-in day — seven tabs for Google Sheets or Excel, $12 once.
Frequently Asked Questions
Is Bellevue or Warwick safer?
Warwick, RI is safer with a total crime rate of 1,227 per 100K vs 1,231 for Bellevue, NE — a 0% difference.
How do violent crime rates compare?
Bellevue has a violent crime rate of 99.2 per 100K while Warwick has 79.5. Warwick has lower violent crime.
About Bellevue, NE
Bellevue, Nebraska, the state's oldest city, borders the Missouri River just south of Omaha. It's home to Offutt Air Force Base, a major employer and a hub for military intelligence. With a safety score of 66/100 and a population coverage of 63,510, Bellevue has a total crime rate of 1,231.3 per 100,000 residents.
About Warwick, RI
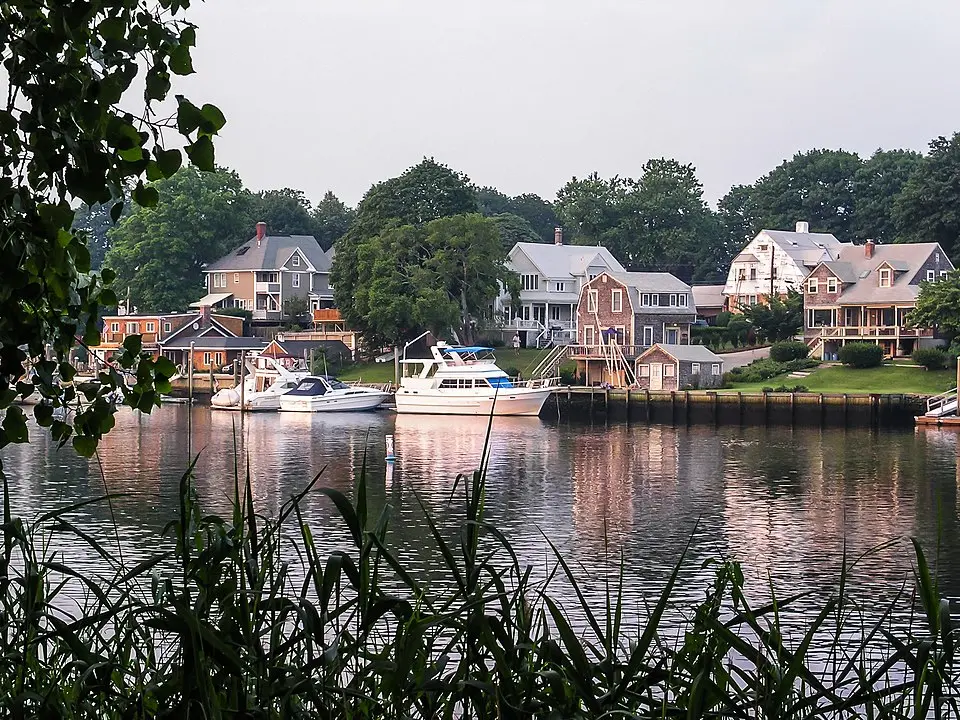
Warwick, Rhode Island, a coastal city in Kent County, boasts a rich history, evident in its numerous colonial-era homes. Located on Narragansett Bay, it is Rhode Island's second-largest city by population. With a safety score of 66/100 and a population coverage of 84,297, Warwick has a total crime rate of 1,226.6 per 100,000 residents.