 Violent
 Property
Total
Property
Total
Quick answer
According to crimebycity.com's analysis of FBI 2024 crime data, Coalinga, CA has a Safety Score of 78/100 — safer than 78% of US cities — with a total crime rate of 902.3 per 100,000 residents, ranking #654 of 2,971 US cities and #17 of 264 in California.
Safety Score
Violent Crime Rate
Property Crime Rate
Is Coalinga, California Safe?
Coalinga, a San Joaquin Valley town, was once a major coal producer, hence its name ("Coaling A" for its railroad stop). Today, it's a small, isolated community in western Fresno County, primarily dependent on agriculture and oil.
Coalinga has a safety score of 78/100 (Safer Than Average). Based on FBI data for 2024, the city reported a total crime rate of 902.3 per 100,000 residents, compared to the national average of 2,752.3 per 100,000.
Coalinga ranks #17 out of 264 cities in California and #654 out of 2971 nationally (safest first). This places it in the 78th percentile for safety — safer than 78% of US cities.
The most elevated crime category in Coalinga is aggravated assault, at 456.9 per 100K — 1.4x the national average. Conversely, robbery is relatively low at just 0.1x the national rate.
Year over year, Coalinga's total crime rate decreased by 32.4%, with violent crime declining 14.4%.
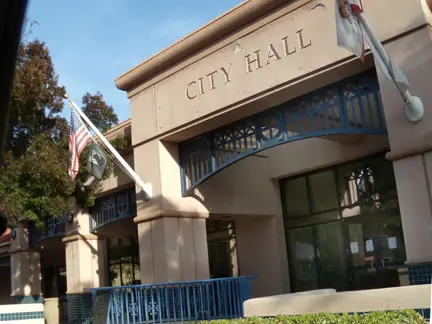
Photo: Wikimedia Commons
Coalinga Crime Statistics Breakdown (2024)
| Crime Type | Incidents | Rate per 100K | National Avg |
|---|---|---|---|
| Violent Crime | 85 | 491.6 | 473.3 |
| Murder | 1 | 5.8 | 6.2 |
| Rape | 3 | 17.4 | 43.4 |
| Robbery | 2 | 11.6 | 93.0 |
| Aggravated Assault | 79 | 456.9 | 330.0 |
| Property Crime | 71 | 410.6 | 2,279.1 |
| Burglary | 17 | 98.3 | 287.8 |
| Larceny-Theft | 46 | 266.1 | 1,638.9 |
| Motor Vehicle Theft | 8 | 46.3 | 352.4 |
| Arson | 0 | 0.0 | 0.0 |
Coalinga vs California Average
How does Coalinga's crime rate compare to the California state average?
| Metric | Coalinga | California Avg | Difference |
|---|---|---|---|
| Violent Crime Rate | 491.6 | 518.0 | -5.1% |
| Property Crime Rate | 410.6 | 2,161.3 | -81.0% |
| Murder Rate | 5.8 | 4.4 | +31.4% |
| Total Crime Rate | 902.3 | 2,679.3 | -66.3% |
Coalinga Crime Rate Trends
Year-over-year crime rate changes for Coalinga, California.
| Year | Coverage | Total Crime Rate | Violent Crime Rate | Property Crime Rate |
|---|---|---|---|---|
| 2024 | 17,290 | 902.3 | 491.6 | 410.6 |
| 2023 | 16,718 | 1,333.9 | 574.2 | 759.7 |
| 2022 | 17,546 | 1,573.0 | 718.1 | 854.9 |
| 2020 | 17,061 | 1,312.9 | 375.1 | 937.8 |
| 2019 | 16,356 | 1,577.4 | 250.7 | 1,326.7 |
Frequently Asked Questions
Is Coalinga, California safe?
Coalinga has a safety score of 78/100, meaning it has less crime than about 78% of US cities in our FBI dataset. With a total crime rate of 902.3 per 100,000 residents in 2024, Coalinga is relatively safe.
What is the crime rate in Coalinga, California?
According to FBI data for 2024, Coalinga has a violent crime rate of 491.6 per 100,000 and a property crime rate of 410.6 per 100,000 residents.
How does Coalinga compare to the national average?
Coalinga's total crime rate of 902.3 per 100,000 can be compared to the national average. The data covers 17,290 residents.
What types of crime are most common in Coalinga?
Based on FBI 2024 data, the most reported crimes in Coalinga include larceny-theft, aggravated assault, and burglary. Property crime is generally more common than violent crime.
Is Coalinga safe to visit?
Like any city, Coalinga has areas that are safer than others. The city's overall safety score is 78/100 based on FBI crime data. Standard travel precautions are recommended.