 Violent
 Property
Total
Property
Total
Quick answer
According to crimebycity.com's analysis of FBI 2024 crime data, Daly City, CA has a Safety Score of 37/100 — higher crime than 63% of US cities — with a total crime rate of 2,105.5 per 100,000 residents, ranking #1,858 of 2,971 US cities and #132 of 264 in California.
Safety Score
Violent Crime Rate
Property Crime Rate
Is Daly City, California Safe?
Daly City, "Gateway to the Peninsula," is a diverse, densely populated city known for its large Filipino American community and iconic fog. Its hillsides offer panoramic views of the Pacific Ocean and San Francisco.
Daly City has a safety score of 37/100 (Higher Crime Than Average). Based on FBI data for 2024, the city reported a total crime rate of 2,105.5 per 100,000 residents, compared to the national average of 2,752.3 per 100,000.
Daly City ranks #132 out of 264 cities in California and #1858 out of 2971 nationally (safest first). This places it in the 37th percentile for safety — with higher crime than 63% of US cities.
Year over year, Daly City's total crime rate decreased by 14.6%, with violent crime declining 16.5%.
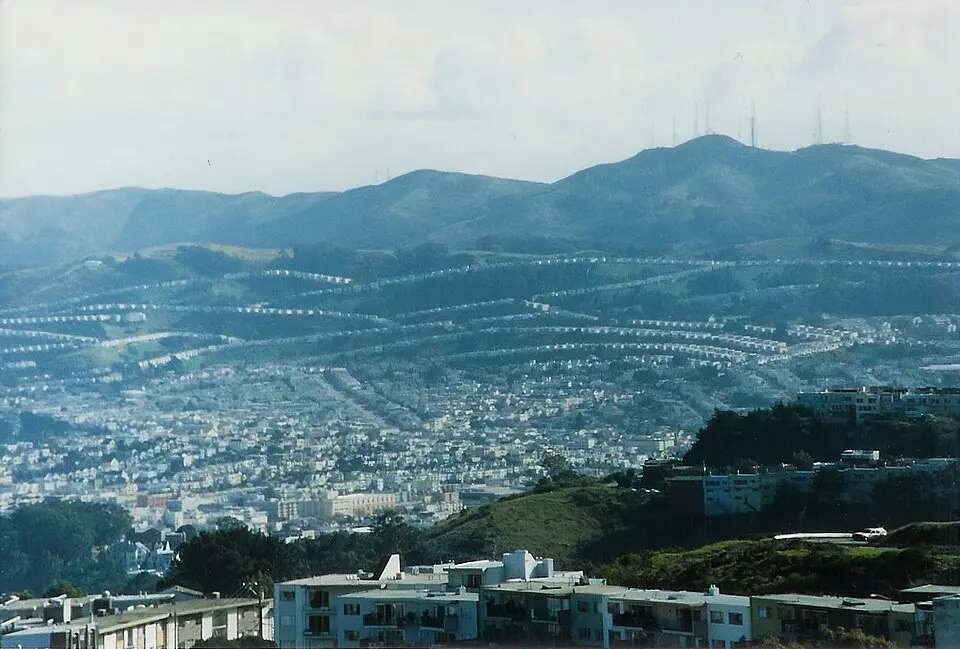
Photo: Wikimedia Commons
Daly City Crime Statistics Breakdown (2024)
| Crime Type | Incidents | Rate per 100K | National Avg |
|---|---|---|---|
| Violent Crime | 292 | 297.3 | 473.3 |
| Murder | 1 | 1.0 | 6.2 |
| Rape | 30 | 30.5 | 43.4 |
| Robbery | 94 | 95.7 | 93.0 |
| Aggravated Assault | 166 | 169.0 | 330.0 |
| Property Crime | 1,776 | 1,808.2 | 2,279.1 |
| Burglary | 94 | 95.7 | 287.8 |
| Larceny-Theft | 1,362 | 1,386.7 | 1,638.9 |
| Motor Vehicle Theft | 320 | 325.8 | 352.4 |
| Arson | 0 | 0.0 | 0.0 |
Daly City vs California Average
How does Daly City's crime rate compare to the California state average?
| Metric | Daly City | California Avg | Difference |
|---|---|---|---|
| Violent Crime Rate | 297.3 | 518.0 | -42.6% |
| Property Crime Rate | 1,808.2 | 2,161.3 | -16.3% |
| Murder Rate | 1.0 | 4.4 | -76.8% |
| Total Crime Rate | 2,105.5 | 2,679.3 | -21.4% |
Daly City Crime Rate Trends
Year-over-year crime rate changes for Daly City, California.
| Year | Coverage | Total Crime Rate | Violent Crime Rate | Property Crime Rate |
|---|---|---|---|---|
| 2024 | 98,217 | 2,105.5 | 297.3 | 1,808.2 |
| 2023 | 97,774 | 2,466.9 | 355.9 | 2,111.0 |
| 2022 | 98,021 | 2,504.6 | 356.1 | 2,148.5 |
| 2020 | 106,855 | 1,546.0 | 179.7 | 1,366.3 |
| 2019 | 107,748 | 1,949.0 | 215.3 | 1,733.7 |
Frequently Asked Questions
Is Daly City, California safe?
Daly City has a safety score of 37/100, meaning it has less crime than about 37% of US cities in our FBI dataset. With a total crime rate of 2,105.5 per 100,000 residents in 2024, Daly City is higher-crime than most US cities.
What is the crime rate in Daly City, California?
According to FBI data for 2024, Daly City has a violent crime rate of 297.3 per 100,000 and a property crime rate of 1,808.2 per 100,000 residents.
How does Daly City compare to the national average?
Daly City's total crime rate of 2,105.5 per 100,000 can be compared to the national average. The data covers 98,217 residents.
What types of crime are most common in Daly City?
Based on FBI 2024 data, the most reported crimes in Daly City include larceny-theft, aggravated assault, and burglary. Property crime is generally more common than violent crime.
Is Daly City safe to visit?
Like any city, Daly City has areas that are safer than others. The city's overall safety score is 37/100 based on FBI crime data. Standard travel precautions are recommended.