 Violent
 Property
Total
Property
Total
Quick answer
According to crimebycity.com's analysis of FBI 2024 crime data, Laguna Beach, CA has a Safety Score of 70/100 — safer than 70% of US cities — with a total crime rate of 1,116.9 per 100,000 residents, ranking #906 of 2,971 US cities and #29 of 264 in California.
Safety Score
Violent Crime Rate
Property Crime Rate
Is Laguna Beach, California Safe?
Laguna Beach, a coastal city in Southern California renowned for its artist community and many art galleries, is nestled among canyons and beaches. Its population of roughly 22,000 residents enjoys a picturesque setting.
Laguna Beach has a safety score of 70/100 (Safer Than Average). Based on FBI data for 2024, the city reported a total crime rate of 1,116.9 per 100,000 residents, compared to the national average of 2,752.3 per 100,000.
Laguna Beach ranks #29 out of 264 cities in California and #906 out of 2971 nationally (safest first). This places it in the 70th percentile for safety — safer than 70% of US cities.
All major crime categories in Laguna Beach are below the national average, with murder particularly low at 0.0x the national rate.
Year over year, Laguna Beach's total crime rate decreased by 45.8%, with violent crime declining 67.2%.
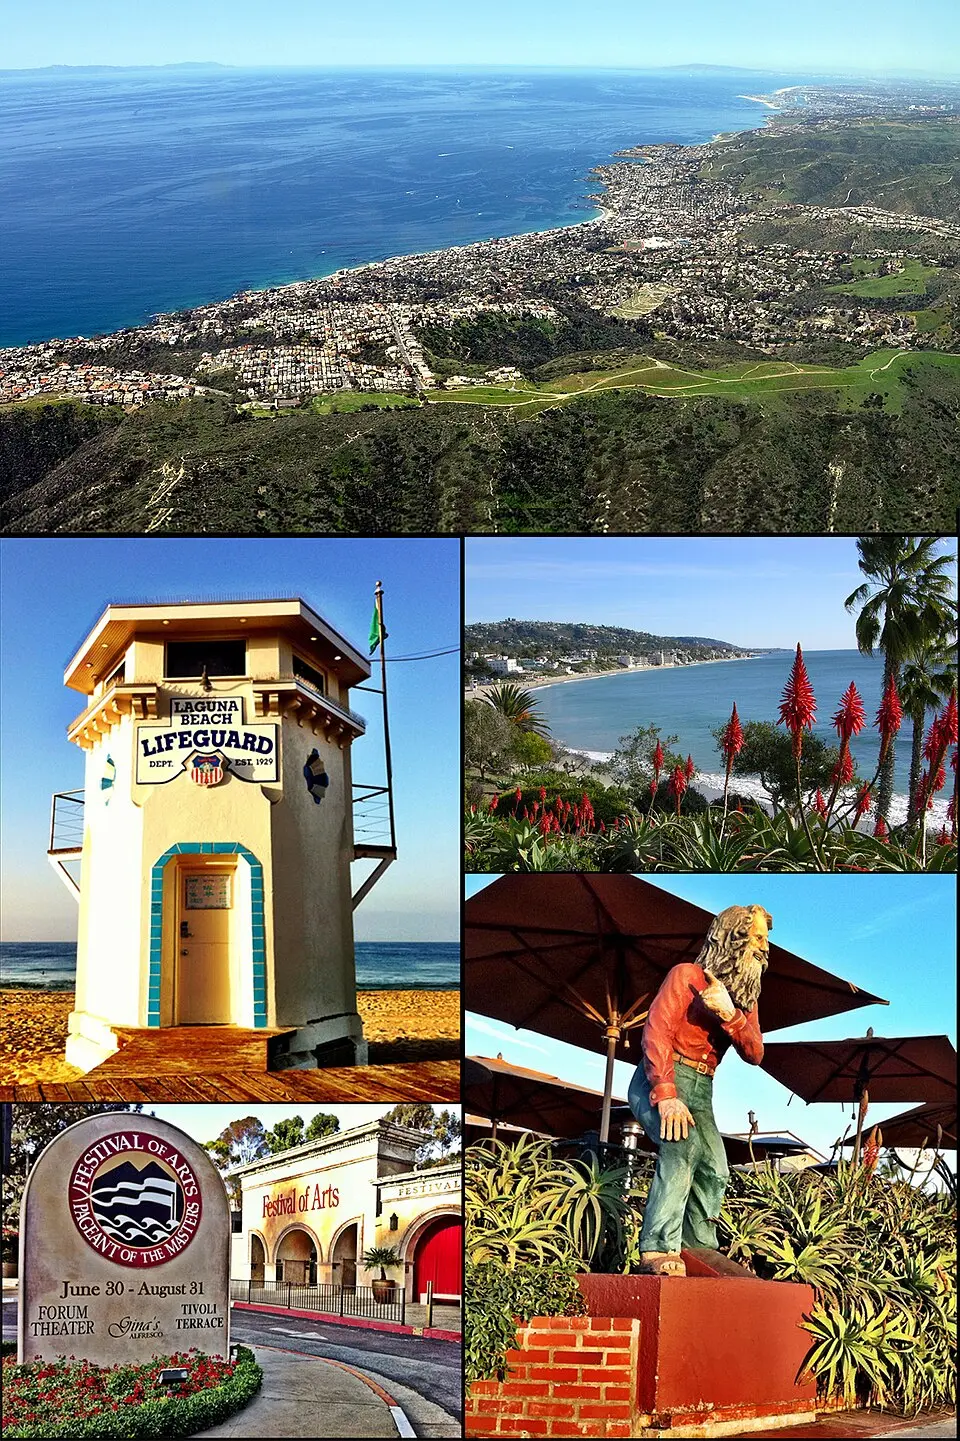
Photo: Wikimedia Commons
Laguna Beach Crime Statistics Breakdown (2024)
| Crime Type | Incidents | Rate per 100K | National Avg |
|---|---|---|---|
| Violent Crime | 37 | 167.3 | 473.3 |
| Murder | 0 | 0.0 | 6.2 |
| Rape | 3 | 13.6 | 43.4 |
| Robbery | 9 | 40.7 | 93.0 |
| Aggravated Assault | 25 | 113.1 | 330.0 |
| Property Crime | 210 | 949.6 | 2,279.1 |
| Burglary | 28 | 126.6 | 287.8 |
| Larceny-Theft | 165 | 746.1 | 1,638.9 |
| Motor Vehicle Theft | 17 | 76.9 | 352.4 |
| Arson | 0 | 0.0 | 0.0 |
Laguna Beach vs California Average
How does Laguna Beach's crime rate compare to the California state average?
| Metric | Laguna Beach | California Avg | Difference |
|---|---|---|---|
| Violent Crime Rate | 167.3 | 518.0 | -67.7% |
| Property Crime Rate | 949.6 | 2,161.3 | -56.1% |
| Murder Rate | 0.0 | 4.4 | -100.0% |
| Total Crime Rate | 1,116.9 | 2,679.3 | -58.3% |
Laguna Beach Crime Rate Trends
Year-over-year crime rate changes for Laguna Beach, California.
| Year | Coverage | Total Crime Rate | Violent Crime Rate | Property Crime Rate |
|---|---|---|---|---|
| 2024 | 22,115 | 1,116.9 | 167.3 | 949.6 |
| 2023 | 22,377 | 2,060.2 | 509.5 | 1,550.7 |
| 2022 | 22,559 | 1,977.0 | 390.1 | 1,587.0 |
| 2020 | 22,834 | 2,185.3 | 389.8 | 1,795.6 |
| 2019 | 23,020 | 1,581.2 | 165.1 | 1,416.2 |
Frequently Asked Questions
Is Laguna Beach, California safe?
Laguna Beach has a safety score of 70/100, meaning it has less crime than about 70% of US cities in our FBI dataset. With a total crime rate of 1,116.9 per 100,000 residents in 2024, Laguna Beach is relatively safe.
What is the crime rate in Laguna Beach, California?
According to FBI data for 2024, Laguna Beach has a violent crime rate of 167.3 per 100,000 and a property crime rate of 949.6 per 100,000 residents.
How does Laguna Beach compare to the national average?
Laguna Beach's total crime rate of 1,116.9 per 100,000 can be compared to the national average. The data covers 22,115 residents.
What types of crime are most common in Laguna Beach?
Based on FBI 2024 data, the most reported crimes in Laguna Beach include larceny-theft, aggravated assault, and burglary. Property crime is generally more common than violent crime.
Is Laguna Beach safe to visit?
Like any city, Laguna Beach has areas that are safer than others. The city's overall safety score is 70/100 based on FBI crime data. Standard travel precautions are recommended.