 Violent
 Property
Total
Property
Total
Quick answer
According to crimebycity.com's analysis of FBI 2024 crime data, Morgan Hill, CA has a Safety Score of 49/100 — higher crime than 51% of US cities — with a total crime rate of 1,703.6 per 100,000 residents, ranking #1,505 of 2,971 US cities and #87 of 264 in California.
Safety Score
Violent Crime Rate
Property Crime Rate
Is Morgan Hill, California Safe?
Morgan Hill, nestled in the southern Santa Clara Valley, is a suburban community known for its agricultural roots, including the annual Mushroom Mardi Gras. Its population of over 45,000 residents enjoys proximity to both Silicon Valley and the open spaces of the Diablo Range.
Morgan Hill has a safety score of 49/100 (Higher Crime Than Average). Based on FBI data for 2024, the city reported a total crime rate of 1,703.6 per 100,000 residents, compared to the national average of 2,752.3 per 100,000.
Morgan Hill ranks #87 out of 264 cities in California and #1505 out of 2971 nationally (safest first). This places it in the 49th percentile for safety — with higher crime than 51% of US cities.
All major crime categories in Morgan Hill are below the national average, with murder particularly low at 0.4x the national rate.
Year over year, Morgan Hill's total crime rate increased by 26.5%, with violent crime declining 21.4%.
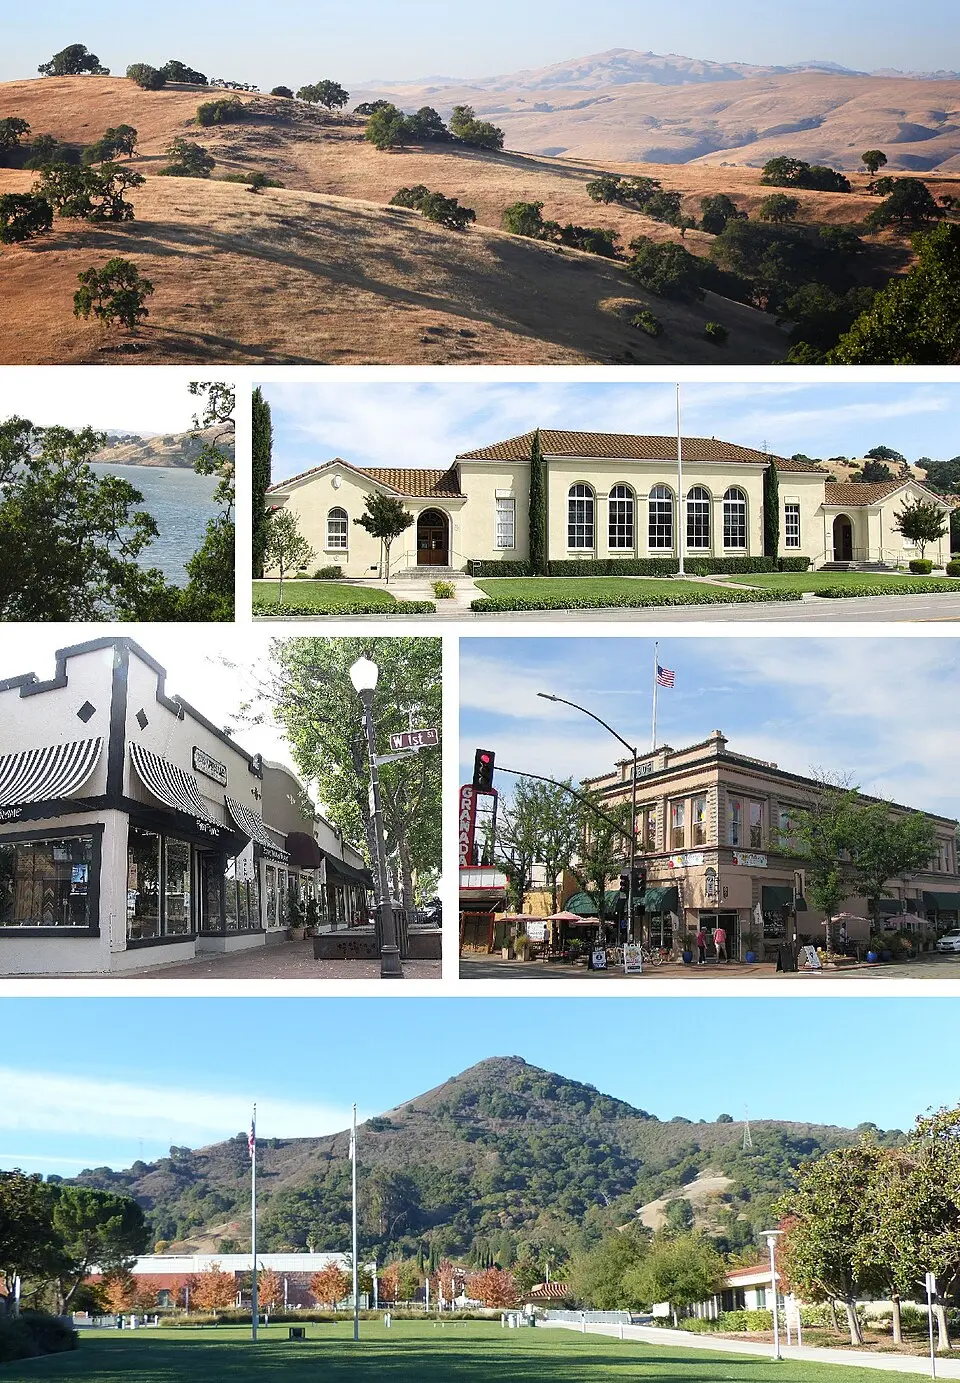
Photo: Wikimedia Commons
Morgan Hill Crime Statistics Breakdown (2024)
| Crime Type | Incidents | Rate per 100K | National Avg |
|---|---|---|---|
| Violent Crime | 86 | 195.1 | 473.3 |
| Murder | 1 | 2.3 | 6.2 |
| Rape | 9 | 20.4 | 43.4 |
| Robbery | 19 | 43.1 | 93.0 |
| Aggravated Assault | 57 | 129.3 | 330.0 |
| Property Crime | 665 | 1,508.5 | 2,279.1 |
| Burglary | 78 | 176.9 | 287.8 |
| Larceny-Theft | 486 | 1,102.5 | 1,638.9 |
| Motor Vehicle Theft | 101 | 229.1 | 352.4 |
| Arson | 0 | 0.0 | 0.0 |
Morgan Hill vs California Average
How does Morgan Hill's crime rate compare to the California state average?
| Metric | Morgan Hill | California Avg | Difference |
|---|---|---|---|
| Violent Crime Rate | 195.1 | 518.0 | -62.3% |
| Property Crime Rate | 1,508.5 | 2,161.3 | -30.2% |
| Murder Rate | 2.3 | 4.4 | -48.4% |
| Total Crime Rate | 1,703.6 | 2,679.3 | -36.4% |
Morgan Hill Crime Rate Trends
Year-over-year crime rate changes for Morgan Hill, California.
| Year | Coverage | Total Crime Rate | Violent Crime Rate | Property Crime Rate |
|---|---|---|---|---|
| 2024 | 44,083 | 1,703.6 | 195.1 | 1,508.5 |
| 2023 | 44,716 | 1,346.3 | 248.2 | 1,098.0 |
| 2022 | 45,134 | 1,774.7 | 321.3 | 1,453.5 |
| 2021 | 46,317 | 1,617.1 | 289.3 | 1,327.8 |
| 2020 | 46,925 | 1,758.1 | 125.7 | 1,632.4 |
| 2019 | 46,118 | 1,637.1 | 112.8 | 1,524.4 |
Frequently Asked Questions
Is Morgan Hill, California safe?
Morgan Hill has a safety score of 49/100, meaning it has less crime than about 49% of US cities in our FBI dataset. With a total crime rate of 1,703.6 per 100,000 residents in 2024, Morgan Hill is higher-crime than most US cities.
What is the crime rate in Morgan Hill, California?
According to FBI data for 2024, Morgan Hill has a violent crime rate of 195.1 per 100,000 and a property crime rate of 1,508.5 per 100,000 residents.
How does Morgan Hill compare to the national average?
Morgan Hill's total crime rate of 1,703.6 per 100,000 can be compared to the national average. The data covers 44,083 residents.
What types of crime are most common in Morgan Hill?
Based on FBI 2024 data, the most reported crimes in Morgan Hill include larceny-theft, aggravated assault, and burglary. Property crime is generally more common than violent crime.
Is Morgan Hill safe to visit?
Like any city, Morgan Hill has areas that are safer than others. The city's overall safety score is 49/100 based on FBI crime data. Standard travel precautions are recommended.