 Violent
Property
Total
Violent
Property
Total
Quick answer
According to crimebycity.com's analysis of FBI 2024 crime data, Newman, CA has a Safety Score of 91/100 — safer than 91% of US cities — with a total crime rate of 543.4 per 100,000 residents, ranking #274 of 2,971 US cities and #2 of 264 in California.
Safety Score
Violent Crime Rate
Property Crime Rate
Is Newman, California Safe?
Newman, a Central Valley city founded by a German immigrant, is known for its annual Fall Festival. This small Stanislaus County community is predominantly agricultural, surrounded by dairy farms and orchards.
Newman has a safety score of 91/100 (Safer Than Average). Based on FBI data for 2024, the city reported a total crime rate of 543.4 per 100,000 residents, compared to the national average of 2,752.3 per 100,000.
Newman ranks #2 out of 264 cities in California and #274 out of 2971 nationally (safest first). This places it in the 91st percentile for safety — safer than 91% of US cities.
All major crime categories in Newman are below the national average, with murder particularly low at 0.0x the national rate.
Year over year, Newman's total crime rate decreased by 26.3%, with violent crime declining 61.9%.
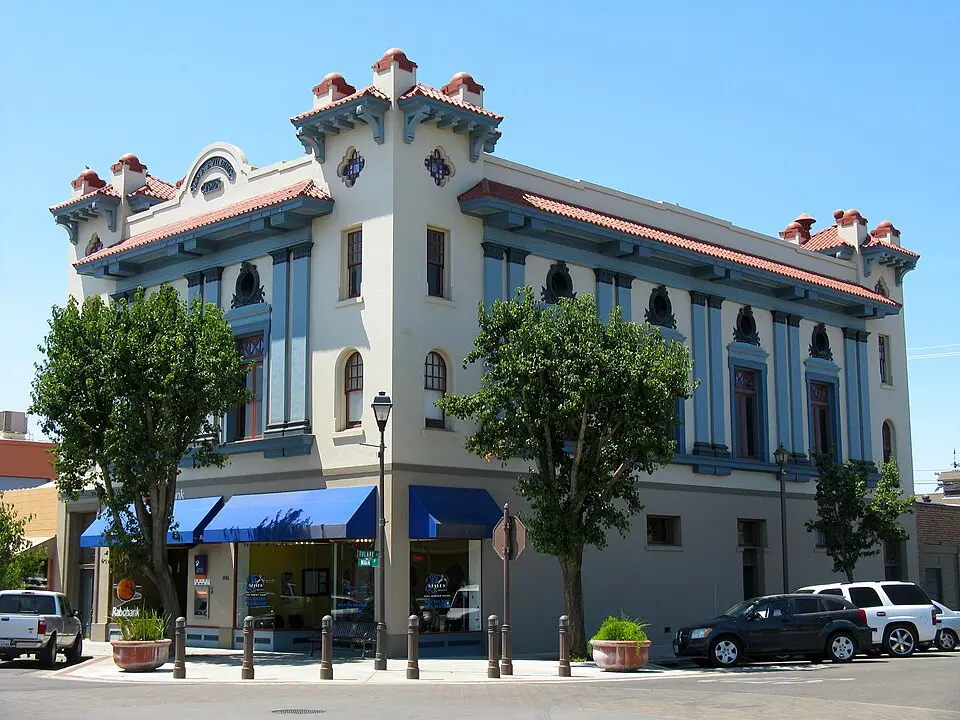
Photo: Wikimedia Commons
Newman Crime Statistics Breakdown (2024)
| Crime Type | Incidents | Rate per 100K | National Avg |
|---|---|---|---|
| Violent Crime | 14 | 115.3 | 473.3 |
| Murder | 0 | 0.0 | 6.2 |
| Rape | 3 | 24.7 | 43.4 |
| Robbery | 3 | 24.7 | 93.0 |
| Aggravated Assault | 8 | 65.9 | 330.0 |
| Property Crime | 52 | 428.1 | 2,279.1 |
| Burglary | 8 | 65.9 | 287.8 |
| Larceny-Theft | 30 | 247.0 | 1,638.9 |
| Motor Vehicle Theft | 14 | 115.3 | 352.4 |
| Arson | 0 | 0.0 | 0.0 |
Newman vs California Average
How does Newman's crime rate compare to the California state average?
| Metric | Newman | California Avg | Difference |
|---|---|---|---|
| Violent Crime Rate | 115.3 | 518.0 | -77.7% |
| Property Crime Rate | 428.1 | 2,161.3 | -80.2% |
| Murder Rate | 0.0 | 4.4 | -100.0% |
| Total Crime Rate | 543.4 | 2,679.3 | -79.7% |
Newman Crime Rate Trends
Year-over-year crime rate changes for Newman, California.
| Year | Coverage | Total Crime Rate | Violent Crime Rate | Property Crime Rate |
|---|---|---|---|---|
| 2024 | 12,146 | 543.4 | 115.3 | 428.1 |
| 2023 | 12,215 | 736.8 | 302.9 | 433.9 |
| 2022 | 12,310 | 1,031.7 | 211.2 | 820.5 |
| 2020 | 11,965 | 1,170.1 | 133.7 | 1,036.4 |
| 2019 | 11,844 | 1,089.2 | 135.1 | 954.1 |
Frequently Asked Questions
Is Newman, California safe?
Newman has a safety score of 91/100, meaning it has less crime than about 91% of US cities in our FBI dataset. With a total crime rate of 543.4 per 100,000 residents in 2024, Newman is relatively safe.
What is the crime rate in Newman, California?
According to FBI data for 2024, Newman has a violent crime rate of 115.3 per 100,000 and a property crime rate of 428.1 per 100,000 residents.
How does Newman compare to the national average?
Newman's total crime rate of 543.4 per 100,000 can be compared to the national average. The data covers 12,146 residents.
What types of crime are most common in Newman?
Based on FBI 2024 data, the most reported crimes in Newman include larceny-theft, aggravated assault, and burglary. Property crime is generally more common than violent crime.
Is Newman safe to visit?
Like any city, Newman has areas that are safer than others. The city's overall safety score is 91/100 based on FBI crime data. Standard travel precautions are recommended.