 Violent
 Property
Total
Property
Total
Quick answer
According to crimebycity.com's analysis of FBI 2024 crime data, San Luis Obispo, CA has a Safety Score of 18/100 — higher crime than 82% of US cities — with a total crime rate of 3,093.2 per 100,000 residents, ranking #2,442 of 2,971 US cities and #213 of 264 in California.
Safety Score
Violent Crime Rate
Property Crime Rate
Is San Luis Obispo, California Safe?
Nestled in California's Central Coast, San Luis Obispo is home to Mission San Luis Obispo de Tolosa, founded in 1772. This city of roughly 47,000 residents boasts a vibrant downtown and is surrounded by rolling hills.
San Luis Obispo has a safety score of 18/100 (High Crime). Based on FBI data for 2024, the city reported a total crime rate of 3,093.2 per 100,000 residents, compared to the national average of 2,752.3 per 100,000.
San Luis Obispo ranks #213 out of 264 cities in California and #2442 out of 2971 nationally (safest first). This places it in the 18th percentile for safety — with higher crime than 82% of US cities.
The most elevated crime category in San Luis Obispo is rape, at 60.1 per 100K — 1.4x the national average. Conversely, murder is relatively low at just 0.0x the national rate.
Year over year, San Luis Obispo's total crime rate decreased by 0.5%, with violent crime declining 18.2%.
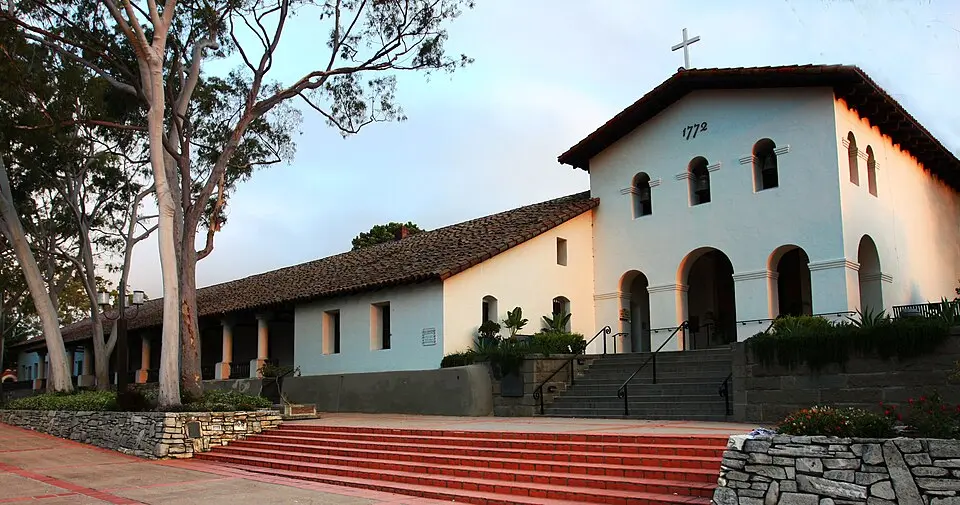
Photo: Wikimedia Commons
San Luis Obispo Crime Statistics Breakdown (2024)
| Crime Type | Incidents | Rate per 100K | National Avg |
|---|---|---|---|
| Violent Crime | 212 | 424.4 | 473.3 |
| Murder | 0 | 0.0 | 6.2 |
| Rape | 30 | 60.1 | 43.4 |
| Robbery | 41 | 82.1 | 93.0 |
| Aggravated Assault | 141 | 282.3 | 330.0 |
| Property Crime | 1,333 | 2,668.8 | 2,279.1 |
| Burglary | 161 | 322.3 | 287.8 |
| Larceny-Theft | 1,097 | 2,196.3 | 1,638.9 |
| Motor Vehicle Theft | 75 | 150.2 | 352.4 |
| Arson | 0 | 0.0 | 0.0 |
San Luis Obispo vs California Average
How does San Luis Obispo's crime rate compare to the California state average?
| Metric | San Luis Obispo | California Avg | Difference |
|---|---|---|---|
| Violent Crime Rate | 424.4 | 518.0 | -18.1% |
| Property Crime Rate | 2,668.8 | 2,161.3 | +23.5% |
| Murder Rate | 0.0 | 4.4 | -100.0% |
| Total Crime Rate | 3,093.2 | 2,679.3 | +15.4% |
San Luis Obispo Crime Rate Trends
Year-over-year crime rate changes for San Luis Obispo, California.
| Year | Coverage | Total Crime Rate | Violent Crime Rate | Property Crime Rate |
|---|---|---|---|---|
| 2024 | 49,948 | 3,093.2 | 424.4 | 2,668.8 |
| 2023 | 48,947 | 3,109.5 | 518.9 | 2,590.6 |
| 2022 | 47,990 | 4,192.5 | 556.4 | 3,636.2 |
| 2020 | 47,722 | 3,828.4 | 433.8 | 3,394.7 |
| 2019 | 47,735 | 4,043.2 | 402.2 | 3,640.9 |
Frequently Asked Questions
Is San Luis Obispo, California safe?
San Luis Obispo has a safety score of 18/100, meaning it has less crime than about 18% of US cities in our FBI dataset. With a total crime rate of 3,093.2 per 100,000 residents in 2024, San Luis Obispo is among the highest-crime US cities.
What is the crime rate in San Luis Obispo, California?
According to FBI data for 2024, San Luis Obispo has a violent crime rate of 424.4 per 100,000 and a property crime rate of 2,668.8 per 100,000 residents.
How does San Luis Obispo compare to the national average?
San Luis Obispo's total crime rate of 3,093.2 per 100,000 can be compared to the national average. The data covers 49,948 residents.
What types of crime are most common in San Luis Obispo?
Based on FBI 2024 data, the most reported crimes in San Luis Obispo include larceny-theft, aggravated assault, and burglary. Property crime is generally more common than violent crime.
Is San Luis Obispo safe to visit?
Like any city, San Luis Obispo has areas that are safer than others. The city's overall safety score is 18/100 based on FBI crime data. Standard travel precautions are recommended.