 Violent
 Property
Total
Property
Total
Quick answer
According to crimebycity.com's analysis of FBI 2024 crime data, South San Francisco, CA has a Safety Score of 45/100 — higher crime than 55% of US cities — with a total crime rate of 1,859.3 per 100,000 residents, ranking #1,642 of 2,971 US cities and #100 of 264 in California.
Safety Score
Violent Crime Rate
Property Crime Rate
Is South San Francisco, California Safe?
South San Francisco, once "The Industrial City," is a diverse Bay Area city located just north of San Francisco International Airport. Its waterfront location and proximity to major biotech firms define much of its character.
South San Francisco has a safety score of 45/100 (Higher Crime Than Average). Based on FBI data for 2024, the city reported a total crime rate of 1,859.3 per 100,000 residents, compared to the national average of 2,752.3 per 100,000.
South San Francisco ranks #100 out of 264 cities in California and #1642 out of 2971 nationally (safest first). This places it in the 45th percentile for safety — with higher crime than 55% of US cities.
Year over year, South San Francisco's total crime rate decreased by 28.6%, with violent crime declining 19.4%.
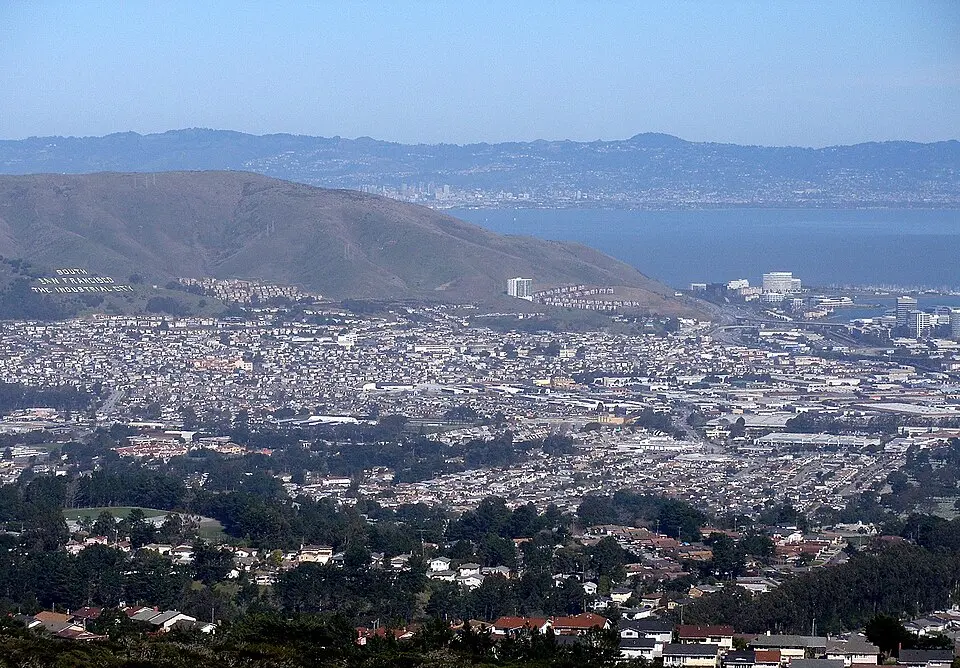
Photo: Wikimedia Commons
South San Francisco Crime Statistics Breakdown (2024)
| Crime Type | Incidents | Rate per 100K | National Avg |
|---|---|---|---|
| Violent Crime | 187 | 300.5 | 473.3 |
| Murder | 0 | 0.0 | 6.2 |
| Rape | 14 | 22.5 | 43.4 |
| Robbery | 22 | 35.4 | 93.0 |
| Aggravated Assault | 151 | 242.7 | 330.0 |
| Property Crime | 970 | 1,558.8 | 2,279.1 |
| Burglary | 64 | 102.9 | 287.8 |
| Larceny-Theft | 689 | 1,107.2 | 1,638.9 |
| Motor Vehicle Theft | 217 | 348.7 | 352.4 |
| Arson | 0 | 0.0 | 0.0 |
South San Francisco vs California Average
How does South San Francisco's crime rate compare to the California state average?
| Metric | South San Francisco | California Avg | Difference |
|---|---|---|---|
| Violent Crime Rate | 300.5 | 518.0 | -42.0% |
| Property Crime Rate | 1,558.8 | 2,161.3 | -27.9% |
| Murder Rate | 0.0 | 4.4 | -100.0% |
| Total Crime Rate | 1,859.3 | 2,679.3 | -30.6% |
South San Francisco Crime Rate Trends
Year-over-year crime rate changes for South San Francisco, California.
| Year | Coverage | Total Crime Rate | Violent Crime Rate | Property Crime Rate |
|---|---|---|---|---|
| 2024 | 62,229 | 1,859.3 | 300.5 | 1,558.8 |
| 2023 | 62,205 | 2,602.7 | 373.0 | 2,229.7 |
| 2022 | 62,427 | 3,232.6 | 398.9 | 2,833.7 |
| 2020 | 68,260 | 2,512.5 | 227.1 | 2,285.4 |
| 2019 | 68,251 | 2,417.6 | 243.2 | 2,174.3 |
Frequently Asked Questions
Is South San Francisco, California safe?
South San Francisco has a safety score of 45/100, meaning it has less crime than about 45% of US cities in our FBI dataset. With a total crime rate of 1,859.3 per 100,000 residents in 2024, South San Francisco is higher-crime than most US cities.
What is the crime rate in South San Francisco, California?
According to FBI data for 2024, South San Francisco has a violent crime rate of 300.5 per 100,000 and a property crime rate of 1,558.8 per 100,000 residents.
How does South San Francisco compare to the national average?
South San Francisco's total crime rate of 1,859.3 per 100,000 can be compared to the national average. The data covers 62,229 residents.
What types of crime are most common in South San Francisco?
Based on FBI 2024 data, the most reported crimes in South San Francisco include larceny-theft, aggravated assault, and burglary. Property crime is generally more common than violent crime.
Is South San Francisco safe to visit?
Like any city, South San Francisco has areas that are safer than others. The city's overall safety score is 45/100 based on FBI crime data. Standard travel precautions are recommended.