 Violent
 Property
Total
Property
Total
Quick answer
According to crimebycity.com's analysis of FBI 2024 crime data, Tracy, CA has a Safety Score of 43/100 — higher crime than 57% of US cities — with a total crime rate of 1,895.1 per 100,000 residents, ranking #1,680 of 2,971 US cities and #108 of 264 in California.
Safety Score
Violent Crime Rate
Property Crime Rate
Is Tracy, California Safe?
Tracy, California, a city in the Central Valley, was once a major railroad hub. Its population has grown significantly, attracting residents seeking more affordable housing away from the Bay Area.
Tracy has a safety score of 43/100 (Higher Crime Than Average). Based on FBI data for 2024, the city reported a total crime rate of 1,895.1 per 100,000 residents, compared to the national average of 2,752.3 per 100,000.
Tracy ranks #108 out of 264 cities in California and #1680 out of 2971 nationally (safest first). This places it in the 43rd percentile for safety — with higher crime than 57% of US cities.
Year over year, Tracy's total crime rate decreased by 1.3%, with violent crime rising 10%.
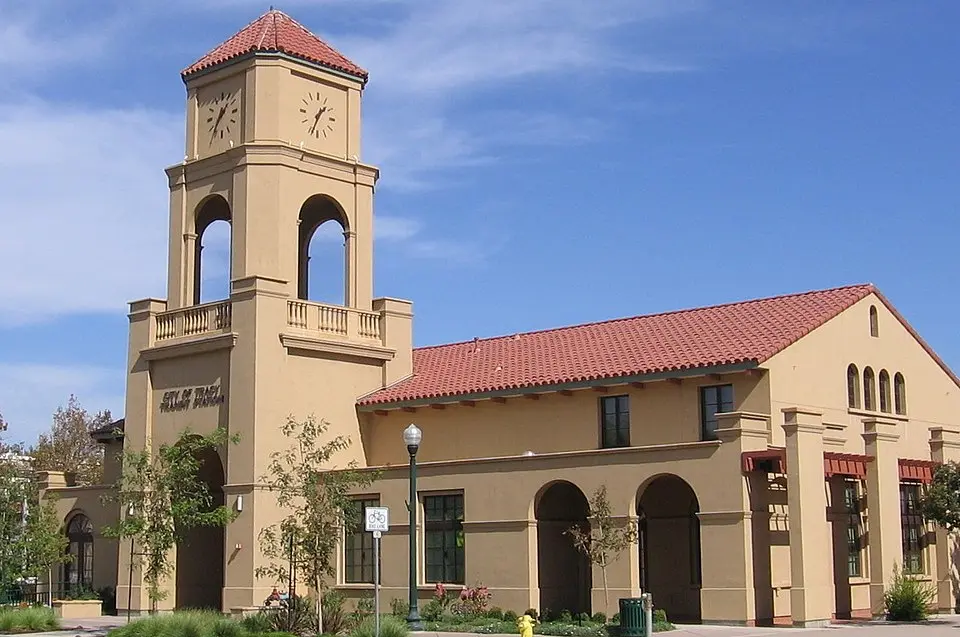
Photo: Wikimedia Commons
Tracy Crime Statistics Breakdown (2024)
| Crime Type | Incidents | Rate per 100K | National Avg |
|---|---|---|---|
| Violent Crime | 302 | 303.5 | 473.3 |
| Murder | 4 | 4.0 | 6.2 |
| Rape | 37 | 37.2 | 43.4 |
| Robbery | 84 | 84.4 | 93.0 |
| Aggravated Assault | 175 | 175.9 | 330.0 |
| Property Crime | 1,584 | 1,591.7 | 2,279.1 |
| Burglary | 153 | 153.7 | 287.8 |
| Larceny-Theft | 1,166 | 1,171.6 | 1,638.9 |
| Motor Vehicle Theft | 265 | 266.3 | 352.4 |
| Arson | 0 | 0.0 | 0.0 |
Tracy vs California Average
How does Tracy's crime rate compare to the California state average?
| Metric | Tracy | California Avg | Difference |
|---|---|---|---|
| Violent Crime Rate | 303.5 | 518.0 | -41.4% |
| Property Crime Rate | 1,591.7 | 2,161.3 | -26.4% |
| Murder Rate | 4.0 | 4.4 | -8.6% |
| Total Crime Rate | 1,895.1 | 2,679.3 | -29.3% |
Tracy Crime Rate Trends
Year-over-year crime rate changes for Tracy, California.
| Year | Coverage | Total Crime Rate | Violent Crime Rate | Property Crime Rate |
|---|---|---|---|---|
| 2024 | 99,519 | 1,895.1 | 303.5 | 1,591.7 |
| 2023 | 99,347 | 1,920.5 | 275.8 | 1,644.7 |
| 2022 | 97,219 | 1,830.9 | 298.3 | 1,532.6 |
| 2021 | 96,252 | 1,617.6 | 207.8 | 1,409.8 |
| 2020 | 96,067 | 1,876.8 | 181.1 | 1,695.7 |
| 2019 | 92,895 | 2,162.7 | 178.7 | 1,984.0 |
Frequently Asked Questions
Is Tracy, California safe?
Tracy has a safety score of 43/100, meaning it has less crime than about 43% of US cities in our FBI dataset. With a total crime rate of 1,895.1 per 100,000 residents in 2024, Tracy is higher-crime than most US cities.
What is the crime rate in Tracy, California?
According to FBI data for 2024, Tracy has a violent crime rate of 303.5 per 100,000 and a property crime rate of 1,591.7 per 100,000 residents.
How does Tracy compare to the national average?
Tracy's total crime rate of 1,895.1 per 100,000 can be compared to the national average. The data covers 99,519 residents.
What types of crime are most common in Tracy?
Based on FBI 2024 data, the most reported crimes in Tracy include larceny-theft, aggravated assault, and burglary. Property crime is generally more common than violent crime.
Is Tracy safe to visit?
Like any city, Tracy has areas that are safer than others. The city's overall safety score is 43/100 based on FBI crime data. Standard travel precautions are recommended.