 Violent
Property
Total
Violent
Property
Total
Quick answer
According to crimebycity.com's analysis of FBI 2024 crime data, Castle Rock, CO has a Safety Score of 75/100 — safer than 75% of US cities — with a total crime rate of 973.9 per 100,000 residents, ranking #732 of 2,971 US cities and #6 of 45 in Colorado.
Safety Score
Violent Crime Rate
Property Crime Rate
Is Castle Rock, Colorado Safe?
Nestled south of Denver, Castle Rock is a growing Front Range community known for its prominent butte and as a former stagecoach stop. The town's population is primarily white, with a median age in the late 30s.
Castle Rock has a safety score of 75/100 (Safer Than Average). Based on FBI data for 2024, the city reported a total crime rate of 973.9 per 100,000 residents, compared to the national average of 2,752.3 per 100,000.
Castle Rock ranks #6 out of 45 cities in Colorado and #732 out of 2971 nationally (safest first). This places it in the 75th percentile for safety — safer than 75% of US cities.
All major crime categories in Castle Rock are below the national average, with murder particularly low at 0.0x the national rate.
Year over year, Castle Rock's total crime rate decreased by 20.8%, with violent crime rising 56.9%.
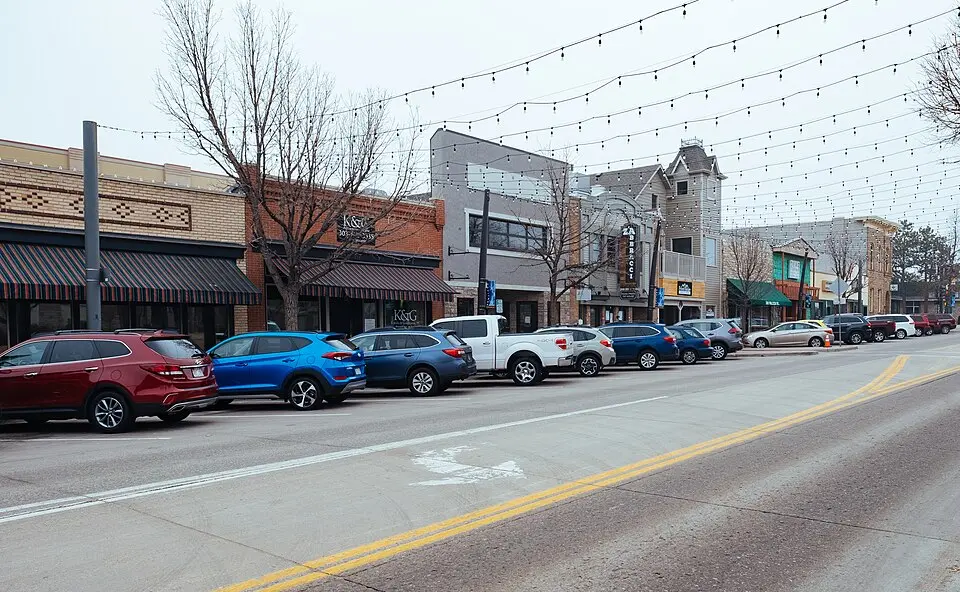
Photo: Wikimedia Commons
Castle Rock Crime Statistics Breakdown (2024)
| Crime Type | Incidents | Rate per 100K | National Avg |
|---|---|---|---|
| Violent Crime | 30 | 35.7 | 473.3 |
| Murder | 0 | 0.0 | 6.2 |
| Rape | 7 | 8.3 | 43.4 |
| Robbery | 5 | 6.0 | 93.0 |
| Aggravated Assault | 18 | 21.4 | 330.0 |
| Property Crime | 789 | 938.2 | 2,279.1 |
| Burglary | 52 | 61.8 | 287.8 |
| Larceny-Theft | 701 | 833.6 | 1,638.9 |
| Motor Vehicle Theft | 36 | 42.8 | 352.4 |
| Arson | 0 | 0.0 | 0.0 |
Castle Rock vs Colorado Average
How does Castle Rock's crime rate compare to the Colorado state average?
| Metric | Castle Rock | Colorado Avg | Difference |
|---|---|---|---|
| Violent Crime Rate | 35.7 | 609.8 | -94.2% |
| Property Crime Rate | 938.2 | 3,256.2 | -71.2% |
| Murder Rate | 0.0 | 5.5 | -100.0% |
| Total Crime Rate | 973.9 | 3,866.0 | -74.8% |
Castle Rock Crime Rate Trends
Year-over-year crime rate changes for Castle Rock, Colorado.
| Year | Coverage | Total Crime Rate | Violent Crime Rate | Property Crime Rate |
|---|---|---|---|---|
| 2024 | 84,098 | 973.9 | 35.7 | 938.2 |
| 2023 | 83,546 | 1,229.3 | 22.7 | 1,206.5 |
| 2022 | 79,102 | 1,204.8 | 35.4 | 1,169.4 |
| 2021 | 73,221 | 1,692.1 | 56.0 | 1,636.1 |
| 2020 | 71,150 | 1,734.4 | 64.7 | 1,669.7 |
| 2019 | 67,208 | 1,476.0 | 44.6 | 1,431.4 |
Frequently Asked Questions
Is Castle Rock, Colorado safe?
Castle Rock has a safety score of 75/100, meaning it has less crime than about 75% of US cities in our FBI dataset. With a total crime rate of 973.9 per 100,000 residents in 2024, Castle Rock is relatively safe.
What is the crime rate in Castle Rock, Colorado?
According to FBI data for 2024, Castle Rock has a violent crime rate of 35.7 per 100,000 and a property crime rate of 938.2 per 100,000 residents.
How does Castle Rock compare to the national average?
Castle Rock's total crime rate of 973.9 per 100,000 can be compared to the national average. The data covers 84,098 residents.
What types of crime are most common in Castle Rock?
Based on FBI 2024 data, the most reported crimes in Castle Rock include larceny-theft, aggravated assault, and burglary. Property crime is generally more common than violent crime.
Is Castle Rock safe to visit?
Like any city, Castle Rock has areas that are safer than others. The city's overall safety score is 75/100 based on FBI crime data. Standard travel precautions are recommended.