 Violent
Property
Total
Violent
Property
Total
Quick answer
According to crimebycity.com's analysis of FBI 2024 crime data, Washington Metropolitan, DC has a Safety Score of 6/100 — higher crime than 94% of US cities — with a total crime rate of 4,513.9 per 100,000 residents, ranking #2,806 of 2,971 US cities and #1 of 1 in District of Columbia.
Safety Score
Violent Crime Rate
Property Crime Rate
Is Washington Metropolitan, District of Columbia Safe?
The Washington Metropolitan Area, encompassing the District of Columbia and parts of surrounding states, is the political heart of the United States. Home to federal institutions and national monuments like the Lincoln Memorial, it has a diverse population exceeding 6 million, with a significant proportion of government employees.
Washington Metropolitan has a safety score of 6/100 (High Crime). Based on FBI data for 2024, the city reported a total crime rate of 4,513.9 per 100,000 residents, compared to the national average of 2,752.3 per 100,000.
Washington Metropolitan ranks #1 out of 1 cities in District of Columbia and #2806 out of 2971 nationally (safest first). This places it in the 6th percentile for safety — with higher crime than 94% of US cities.
The most elevated crime category in Washington Metropolitan is robbery, at 438.6 per 100K — 4.7x the national average. Conversely, rape is relatively low at just 0.8x the national rate.
Year over year, Washington Metropolitan's total crime rate decreased by 13.3%, with violent crime declining 11.6%.
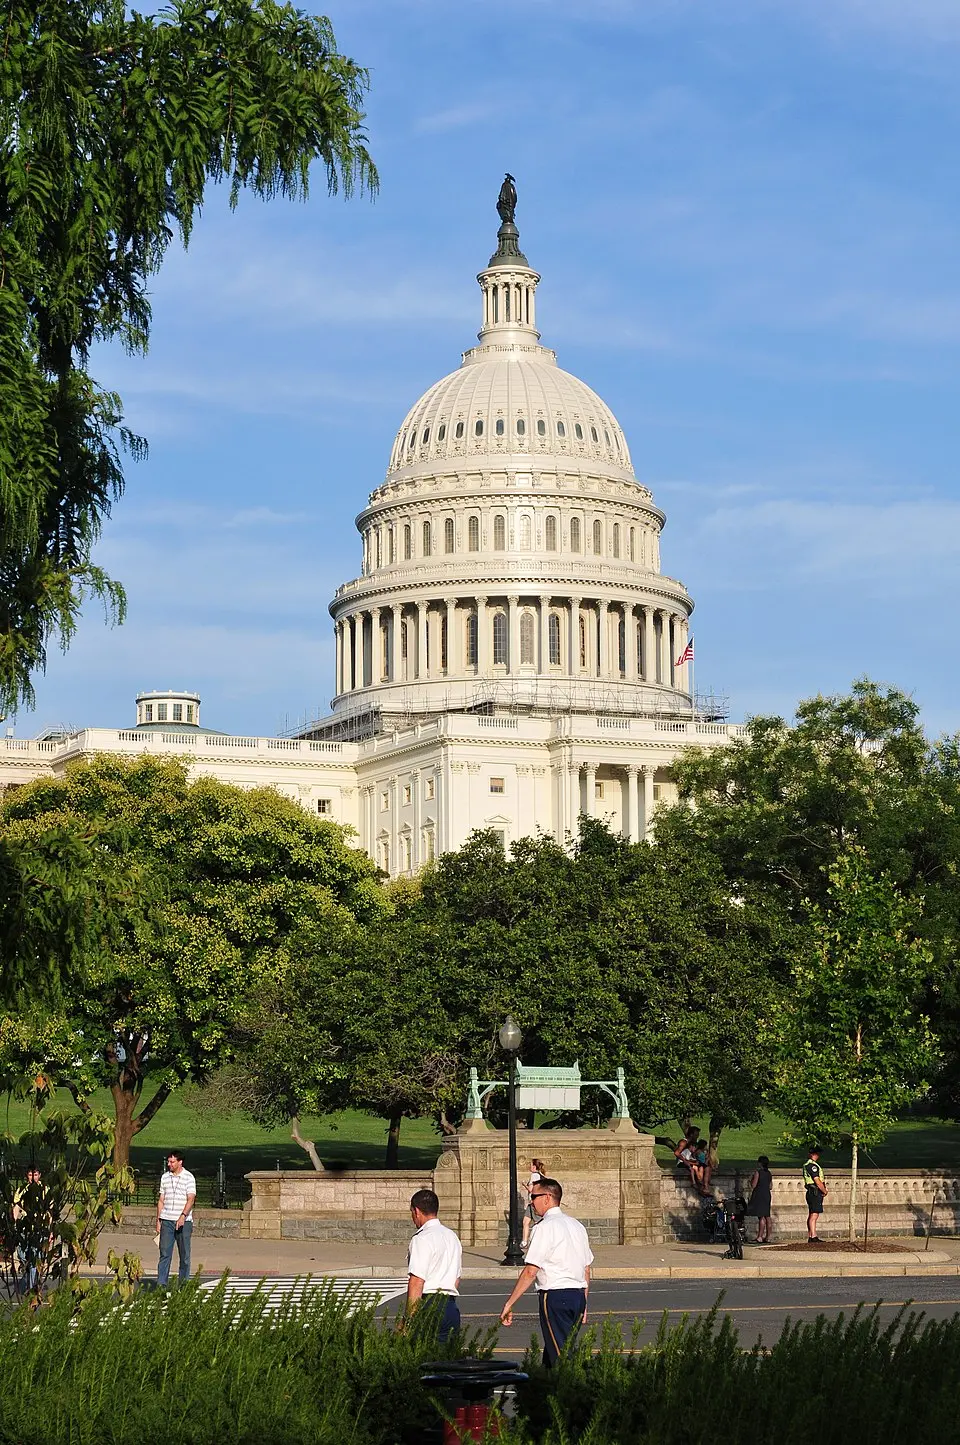
Photo: Wikimedia Commons
Washington Metropolitan Crime Statistics Breakdown (2024)
| Crime Type | Incidents | Rate per 100K | National Avg |
|---|---|---|---|
| Violent Crime | 6,502 | 925.9 | 473.3 |
| Murder | 179 | 25.5 | 6.2 |
| Rape | 239 | 34.0 | 43.4 |
| Robbery | 3,080 | 438.6 | 93.0 |
| Aggravated Assault | 3,004 | 427.8 | 330.0 |
| Property Crime | 25,197 | 3,588.0 | 2,279.1 |
| Burglary | 1,671 | 238.0 | 287.8 |
| Larceny-Theft | 18,220 | 2,594.5 | 1,638.9 |
| Motor Vehicle Theft | 5,306 | 755.6 | 352.4 |
| Arson | 0 | 0.0 | 0.0 |
Washington Metropolitan vs District of Columbia Average
How does Washington Metropolitan's crime rate compare to the District of Columbia state average?
| Metric | Washington Metropolitan | District of Columbia Avg | Difference |
|---|---|---|---|
| Violent Crime Rate | 925.9 | 925.9 | +0.0% |
| Property Crime Rate | 3,588.0 | 3,588.0 | +0.0% |
| Murder Rate | 25.5 | 25.5 | +0.0% |
| Total Crime Rate | 4,513.9 | 4,513.9 | +0.0% |
Washington Metropolitan Crime Rate Trends
Year-over-year crime rate changes for Washington Metropolitan, District of Columbia.
| Year | Coverage | Total Crime Rate | Violent Crime Rate | Property Crime Rate |
|---|---|---|---|---|
| 2024 | 702,250 | 4,513.9 | 925.9 | 3,588.0 |
| 2023 | 678,972 | 5,205.1 | 1,047.5 | 4,157.6 |
| 2022 | 671,803 | 4,246.8 | 748.0 | 3,498.8 |
| 2021 | 670,050 | 2,074.5 | 371.5 | 1,703.0 |
| 2020 | 712,816 | 4,389.2 | 957.9 | 3,431.3 |
| 2019 | 705,749 | 5,223.0 | 977.1 | 4,245.8 |
Frequently Asked Questions
Is Washington Metropolitan, District of Columbia safe?
Washington Metropolitan has a safety score of 6/100, meaning it has less crime than about 6% of US cities in our FBI dataset. With a total crime rate of 4,513.9 per 100,000 residents in 2024, Washington Metropolitan is among the highest-crime US cities.
What is the crime rate in Washington Metropolitan, District of Columbia?
According to FBI data for 2024, Washington Metropolitan has a violent crime rate of 925.9 per 100,000 and a property crime rate of 3,588.0 per 100,000 residents.
How does Washington Metropolitan compare to the national average?
Washington Metropolitan's total crime rate of 4,513.9 per 100,000 can be compared to the national average. The data covers 702,250 residents.
What types of crime are most common in Washington Metropolitan?
Based on FBI 2024 data, the most reported crimes in Washington Metropolitan include larceny-theft, aggravated assault, and burglary. Property crime is generally more common than violent crime.
Is Washington Metropolitan safe to visit?
Like any city, Washington Metropolitan has areas that are safer than others. The city's overall safety score is 6/100 based on FBI crime data. Standard travel precautions are recommended.