 Violent
 Property
Total
Property
Total
Quick answer
According to crimebycity.com's analysis of FBI 2024 crime data, Lilburn, GA has a Safety Score of 29/100 — higher crime than 71% of US cities — with a total crime rate of 2,453.4 per 100,000 residents, ranking #2,104 of 2,971 US cities and #40 of 70 in Georgia.
Safety Score
Violent Crime Rate
Property Crime Rate
Is Lilburn, Georgia Safe?
Lilburn, Georgia, once home to a popular railroad depot, is a diverse suburb in Gwinnett County. Its residential areas and local businesses are nestled amidst rolling hills and streams.
Lilburn has a safety score of 29/100 (High Crime). Based on FBI data for 2024, the city reported a total crime rate of 2,453.4 per 100,000 residents, compared to the national average of 2,752.3 per 100,000.
Lilburn ranks #40 out of 70 cities in Georgia and #2104 out of 2971 nationally (safest first). This places it in the 29th percentile for safety — with higher crime than 71% of US cities.
Year over year, Lilburn's total crime rate decreased by 6.6%, with violent crime rising 19.9%.
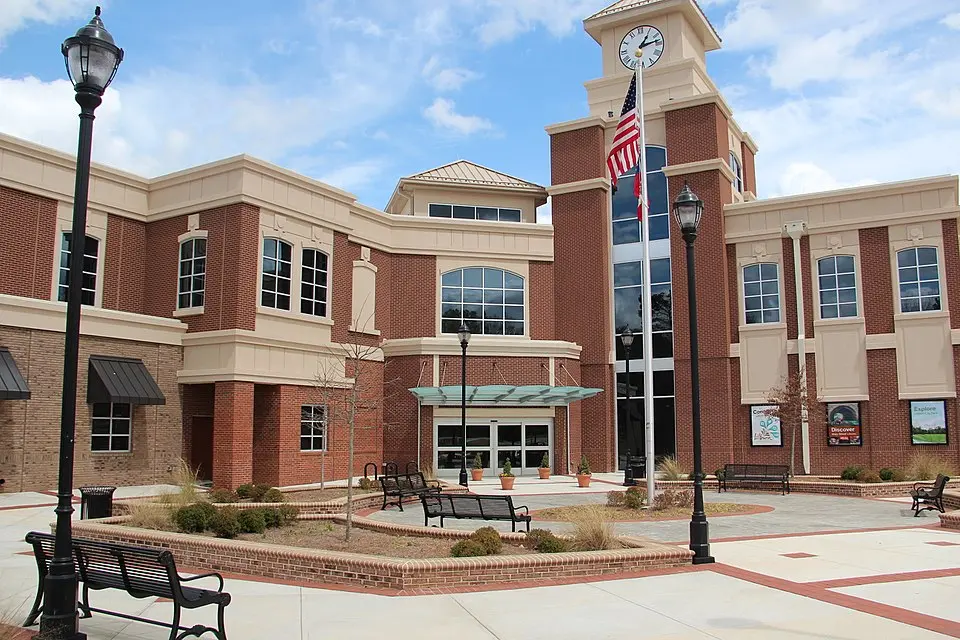
Photo: Wikimedia Commons
Lilburn Crime Statistics Breakdown (2024)
| Crime Type | Incidents | Rate per 100K | National Avg |
|---|---|---|---|
| Violent Crime | 29 | 176.6 | 473.3 |
| Murder | 1 | 6.1 | 6.2 |
| Rape | 1 | 6.1 | 43.4 |
| Robbery | 9 | 54.8 | 93.0 |
| Aggravated Assault | 18 | 109.6 | 330.0 |
| Property Crime | 374 | 2,276.9 | 2,279.1 |
| Burglary | 47 | 286.1 | 287.8 |
| Larceny-Theft | 298 | 1,814.2 | 1,638.9 |
| Motor Vehicle Theft | 29 | 176.6 | 352.4 |
| Arson | 0 | 0.0 | 0.0 |
Lilburn vs Georgia Average
How does Lilburn's crime rate compare to the Georgia state average?
| Metric | Lilburn | Georgia Avg | Difference |
|---|---|---|---|
| Violent Crime Rate | 176.6 | 345.0 | -48.8% |
| Property Crime Rate | 2,276.9 | 1,941.1 | +17.3% |
| Murder Rate | 6.1 | 7.5 | -18.5% |
| Total Crime Rate | 2,453.4 | 2,286.1 | +7.3% |
Lilburn Crime Rate Trends
Year-over-year crime rate changes for Lilburn, Georgia.
| Year | Coverage | Total Crime Rate | Violent Crime Rate | Property Crime Rate |
|---|---|---|---|---|
| 2024 | 16,426 | 2,453.4 | 176.6 | 2,276.9 |
| 2023 | 16,302 | 2,625.4 | 147.2 | 2,478.2 |
| 2022 | 15,823 | 2,407.9 | 221.2 | 2,186.7 |
| 2021 | 13,199 | 2,848.7 | 204.6 | 2,644.1 |
| 2020 | 12,941 | 2,434.1 | 262.7 | 2,171.4 |
| 2019 | 12,769 | 2,952.5 | 180.1 | 2,772.3 |
Frequently Asked Questions
Is Lilburn, Georgia safe?
Lilburn has a safety score of 29/100, meaning it has less crime than about 29% of US cities in our FBI dataset. With a total crime rate of 2,453.4 per 100,000 residents in 2024, Lilburn is among the highest-crime US cities.
What is the crime rate in Lilburn, Georgia?
According to FBI data for 2024, Lilburn has a violent crime rate of 176.6 per 100,000 and a property crime rate of 2,276.9 per 100,000 residents.
How does Lilburn compare to the national average?
Lilburn's total crime rate of 2,453.4 per 100,000 can be compared to the national average. The data covers 16,426 residents.
What types of crime are most common in Lilburn?
Based on FBI 2024 data, the most reported crimes in Lilburn include larceny-theft, aggravated assault, and burglary. Property crime is generally more common than violent crime.
Is Lilburn safe to visit?
Like any city, Lilburn has areas that are safer than others. The city's overall safety score is 29/100 based on FBI crime data. Standard travel precautions are recommended.