 Violent
Property
Total
Violent
Property
Total
Quick answer
According to crimebycity.com's analysis of FBI 2024 crime data, Arlington Heights, IL has a Safety Score of 77/100 — safer than 77% of US cities — with a total crime rate of 930.0 per 100,000 residents, ranking #683 of 2,971 US cities and #68 of 184 in Illinois.
Safety Score
Violent Crime Rate
Property Crime Rate
Is Arlington Heights, Illinois Safe?
Arlington Heights, a large village in Cook County, is home to the former Arlington Park thoroughbred racetrack. This Chicago suburb features a mix of residential areas and commercial centers.
Arlington Heights has a safety score of 77/100 (Safer Than Average). Based on FBI data for 2024, the city reported a total crime rate of 930.0 per 100,000 residents, compared to the national average of 2,752.3 per 100,000.
Arlington Heights ranks #68 out of 184 cities in Illinois and #683 out of 2971 nationally (safest first). This places it in the 77th percentile for safety — safer than 77% of US cities.
All major crime categories in Arlington Heights are below the national average, with murder particularly low at 0.0x the national rate.
Year over year, Arlington Heights's total crime rate decreased by 8.7%, with violent crime declining 39.9%.
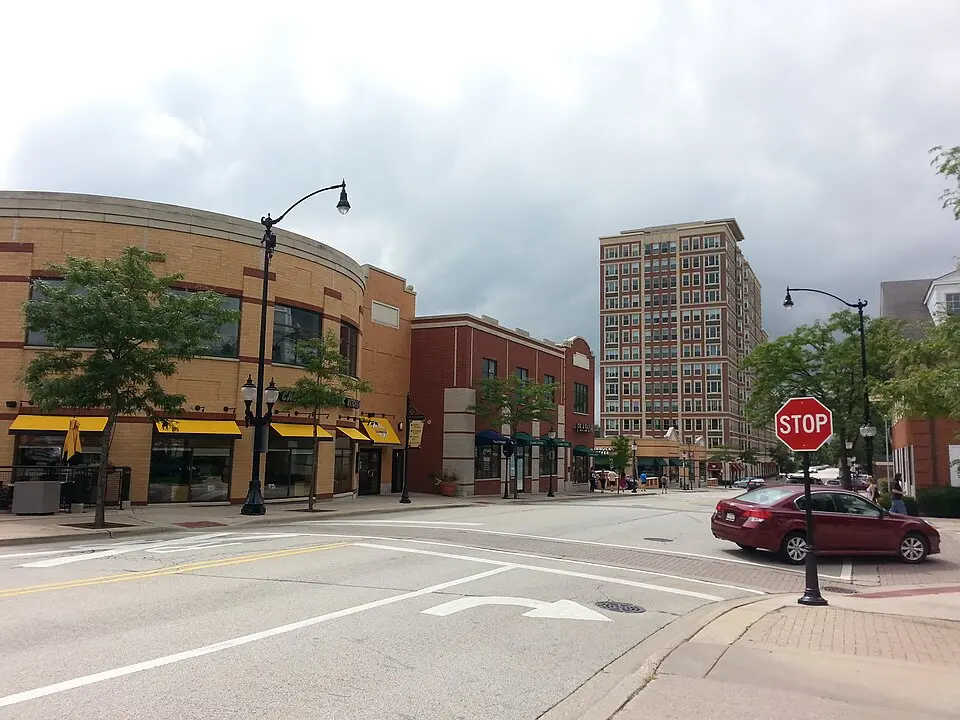
Photo: Wikimedia Commons
Arlington Heights Crime Statistics Breakdown (2024)
| Crime Type | Incidents | Rate per 100K | National Avg |
|---|---|---|---|
| Violent Crime | 37 | 50.3 | 473.3 |
| Murder | 0 | 0.0 | 6.2 |
| Rape | 10 | 13.6 | 43.4 |
| Robbery | 8 | 10.9 | 93.0 |
| Aggravated Assault | 19 | 25.8 | 330.0 |
| Property Crime | 647 | 879.7 | 2,279.1 |
| Burglary | 118 | 160.5 | 287.8 |
| Larceny-Theft | 473 | 643.1 | 1,638.9 |
| Motor Vehicle Theft | 56 | 76.1 | 352.4 |
| Arson | 0 | 0.0 | 0.0 |
Arlington Heights vs Illinois Average
How does Arlington Heights's crime rate compare to the Illinois state average?
| Metric | Arlington Heights | Illinois Avg | Difference |
|---|---|---|---|
| Violent Crime Rate | 50.3 | 356.4 | -85.9% |
| Property Crime Rate | 879.7 | 2,126.5 | -58.6% |
| Murder Rate | 0.0 | 7.9 | -100.0% |
| Total Crime Rate | 930.0 | 2,482.9 | -62.5% |
Arlington Heights Crime Rate Trends
Year-over-year crime rate changes for Arlington Heights, Illinois.
| Year | Coverage | Total Crime Rate | Violent Crime Rate | Property Crime Rate |
|---|---|---|---|---|
| 2024 | 73,545 | 930.0 | 50.3 | 879.7 |
| 2023 | 74,094 | 1,019.0 | 83.7 | 935.3 |
| 2022 | 74,648 | 1,156.1 | 73.7 | 1,082.4 |
| 2021 | 73,876 | 729.6 | 40.6 | 689.0 |
| 2020 | 74,706 | 788.4 | 57.6 | 730.9 |
| 2019 | 75,249 | 841.2 | 43.9 | 797.4 |
Frequently Asked Questions
Is Arlington Heights, Illinois safe?
Arlington Heights has a safety score of 77/100, meaning it has less crime than about 77% of US cities in our FBI dataset. With a total crime rate of 930.0 per 100,000 residents in 2024, Arlington Heights is relatively safe.
What is the crime rate in Arlington Heights, Illinois?
According to FBI data for 2024, Arlington Heights has a violent crime rate of 50.3 per 100,000 and a property crime rate of 879.7 per 100,000 residents.
How does Arlington Heights compare to the national average?
Arlington Heights's total crime rate of 930.0 per 100,000 can be compared to the national average. The data covers 73,545 residents.
What types of crime are most common in Arlington Heights?
Based on FBI 2024 data, the most reported crimes in Arlington Heights include larceny-theft, aggravated assault, and burglary. Property crime is generally more common than violent crime.
Is Arlington Heights safe to visit?
Like any city, Arlington Heights has areas that are safer than others. The city's overall safety score is 77/100 based on FBI crime data. Standard travel precautions are recommended.