 Violent
 Property
Total
Property
Total
Quick answer
According to crimebycity.com's analysis of FBI 2024 crime data, Bolingbrook, IL has a Safety Score of 76/100 — safer than 76% of US cities — with a total crime rate of 961.2 per 100,000 residents, ranking #718 of 2,971 US cities and #71 of 184 in Illinois.
Safety Score
Violent Crime Rate
Property Crime Rate
Is Bolingbrook, Illinois Safe?
Bolingbrook, a large suburb southwest of Chicago, grew rapidly in the latter half of the 20th century. It is known for having a diverse population and its distinctive "Flying B" logo.
Bolingbrook has a safety score of 76/100 (Safer Than Average). Based on FBI data for 2024, the city reported a total crime rate of 961.2 per 100,000 residents, compared to the national average of 2,752.3 per 100,000.
Bolingbrook ranks #71 out of 184 cities in Illinois and #718 out of 2971 nationally (safest first). This places it in the 76th percentile for safety — safer than 76% of US cities.
Year over year, Bolingbrook's total crime rate decreased by 12.8%, with violent crime declining 16.7%.
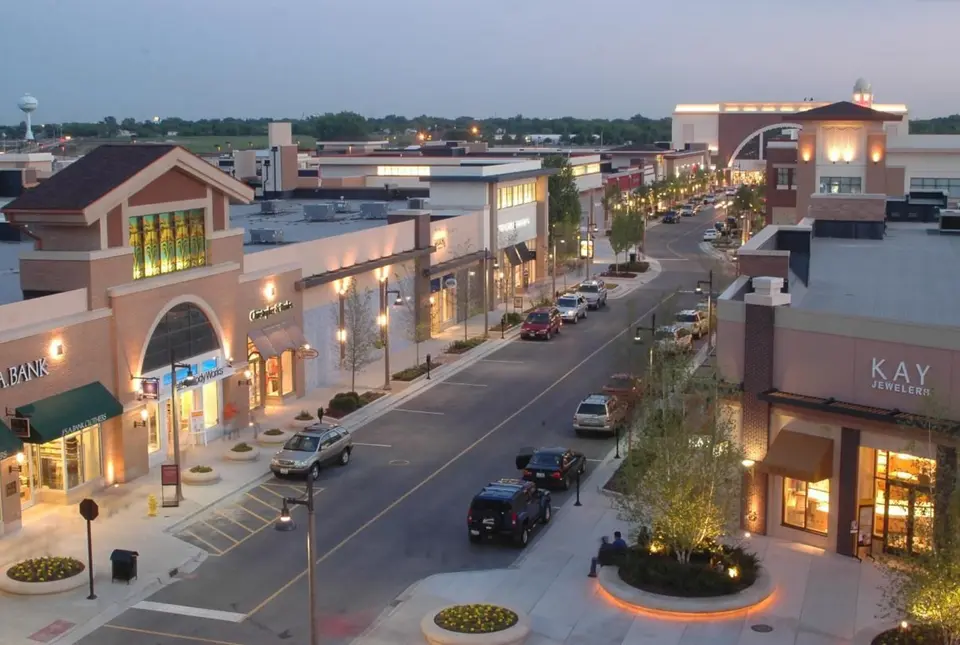
Photo: Wikimedia Commons
Bolingbrook Crime Statistics Breakdown (2024)
| Crime Type | Incidents | Rate per 100K | National Avg |
|---|---|---|---|
| Violent Crime | 135 | 182.0 | 473.3 |
| Murder | 1 | 1.4 | 6.2 |
| Rape | 33 | 44.5 | 43.4 |
| Robbery | 13 | 17.5 | 93.0 |
| Aggravated Assault | 88 | 118.6 | 330.0 |
| Property Crime | 578 | 779.2 | 2,279.1 |
| Burglary | 179 | 241.3 | 287.8 |
| Larceny-Theft | 324 | 436.8 | 1,638.9 |
| Motor Vehicle Theft | 75 | 101.1 | 352.4 |
| Arson | 0 | 0.0 | 0.0 |
Bolingbrook vs Illinois Average
How does Bolingbrook's crime rate compare to the Illinois state average?
| Metric | Bolingbrook | Illinois Avg | Difference |
|---|---|---|---|
| Violent Crime Rate | 182.0 | 356.4 | -48.9% |
| Property Crime Rate | 779.2 | 2,126.5 | -63.4% |
| Murder Rate | 1.4 | 7.9 | -82.8% |
| Total Crime Rate | 961.2 | 2,482.9 | -61.3% |
Bolingbrook Crime Rate Trends
Year-over-year crime rate changes for Bolingbrook, Illinois.
| Year | Coverage | Total Crime Rate | Violent Crime Rate | Property Crime Rate |
|---|---|---|---|---|
| 2024 | 74,177 | 961.2 | 182.0 | 779.2 |
| 2023 | 74,138 | 1,102.0 | 218.5 | 883.5 |
| 2022 | 73,364 | 982.8 | 216.7 | 766.0 |
| 2021 | 74,081 | 580.5 | 141.7 | 438.7 |
| 2020 | 74,665 | 888.0 | 174.1 | 713.9 |
| 2019 | 75,394 | 1,025.3 | 163.1 | 862.1 |
Frequently Asked Questions
Is Bolingbrook, Illinois safe?
Bolingbrook has a safety score of 76/100, meaning it has less crime than about 76% of US cities in our FBI dataset. With a total crime rate of 961.2 per 100,000 residents in 2024, Bolingbrook is relatively safe.
What is the crime rate in Bolingbrook, Illinois?
According to FBI data for 2024, Bolingbrook has a violent crime rate of 182.0 per 100,000 and a property crime rate of 779.2 per 100,000 residents.
How does Bolingbrook compare to the national average?
Bolingbrook's total crime rate of 961.2 per 100,000 can be compared to the national average. The data covers 74,177 residents.
What types of crime are most common in Bolingbrook?
Based on FBI 2024 data, the most reported crimes in Bolingbrook include larceny-theft, aggravated assault, and burglary. Property crime is generally more common than violent crime.
Is Bolingbrook safe to visit?
Like any city, Bolingbrook has areas that are safer than others. The city's overall safety score is 76/100 based on FBI crime data. Standard travel precautions are recommended.