 Violent
 Property
Total
Property
Total
Quick answer
According to crimebycity.com's analysis of FBI 2024 crime data, Lindenhurst, IL has a Safety Score of 99/100 — safer than 99% of US cities — with a total crime rate of 188.5 per 100,000 residents, ranking #19 of 2,971 US cities and #3 of 184 in Illinois.
Safety Score
Violent Crime Rate
Property Crime Rate
Is Lindenhurst, Illinois Safe?
Lindenhurst, Illinois, a village established in 1956, is located in Lake County. It's home to a significant portion of the Chain O'Lakes State Park, attracting nature enthusiasts.
Lindenhurst has a safety score of 99/100 (Safer Than Average). Based on FBI data for 2024, the city reported a total crime rate of 188.5 per 100,000 residents, compared to the national average of 2,752.3 per 100,000.
Lindenhurst ranks #3 out of 184 cities in Illinois and #19 out of 2971 nationally (safest first). This places it in the 99th percentile for safety — safer than 99% of US cities.
All major crime categories in Lindenhurst are below the national average, with murder particularly low at 0.0x the national rate.
Year over year, Lindenhurst's total crime rate decreased by 51.2%, with violent crime declining 54.8%.
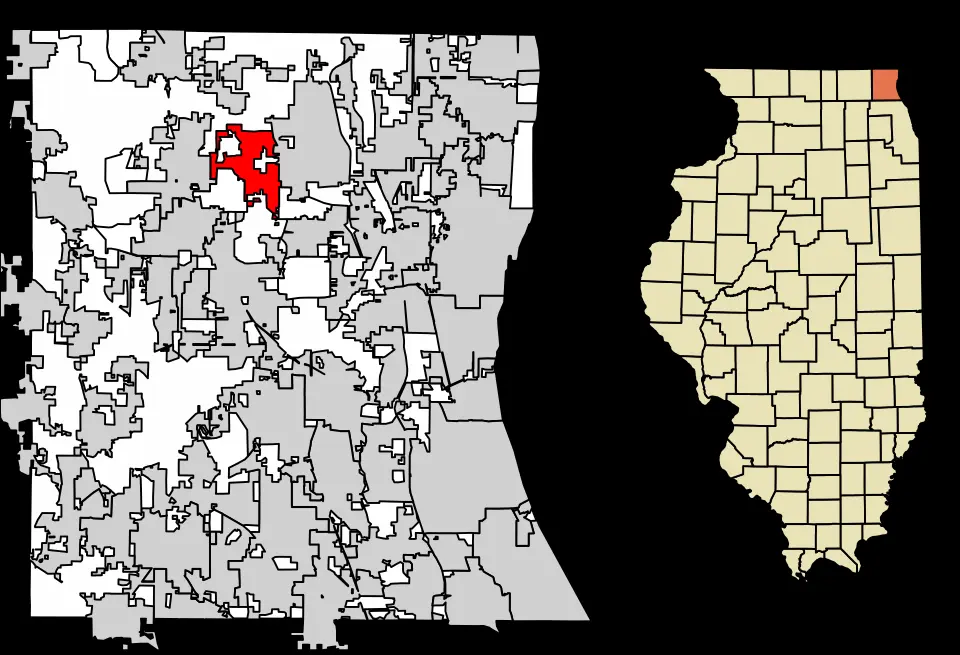
Photo: Wikimedia Commons
Lindenhurst Crime Statistics Breakdown (2024)
| Crime Type | Incidents | Rate per 100K | National Avg |
|---|---|---|---|
| Violent Crime | 5 | 34.9 | 473.3 |
| Murder | 0 | 0.0 | 6.2 |
| Rape | 4 | 27.9 | 43.4 |
| Robbery | 0 | 0.0 | 93.0 |
| Aggravated Assault | 1 | 7.0 | 330.0 |
| Property Crime | 22 | 153.6 | 2,279.1 |
| Burglary | 5 | 34.9 | 287.8 |
| Larceny-Theft | 17 | 118.7 | 1,638.9 |
| Motor Vehicle Theft | 0 | 0.0 | 352.4 |
| Arson | 0 | 0.0 | 0.0 |
Lindenhurst vs Illinois Average
How does Lindenhurst's crime rate compare to the Illinois state average?
| Metric | Lindenhurst | Illinois Avg | Difference |
|---|---|---|---|
| Violent Crime Rate | 34.9 | 356.4 | -90.2% |
| Property Crime Rate | 153.6 | 2,126.5 | -92.8% |
| Murder Rate | 0.0 | 7.9 | -100.0% |
| Total Crime Rate | 188.5 | 2,482.9 | -92.4% |
Lindenhurst Crime Rate Trends
Year-over-year crime rate changes for Lindenhurst, Illinois.
| Year | Coverage | Total Crime Rate | Violent Crime Rate | Property Crime Rate |
|---|---|---|---|---|
| 2024 | 14,327 | 188.5 | 34.9 | 153.6 |
| 2022 | 14,242 | 386.2 | 77.2 | 309.0 |
| 2021 | 14,070 | 213.2 | 42.6 | 170.6 |
| 2020 | 14,174 | 331.6 | 42.3 | 289.3 |
| 2019 | 14,296 | 328.8 | 35.0 | 293.8 |
Frequently Asked Questions
Is Lindenhurst, Illinois safe?
Lindenhurst has a safety score of 99/100, meaning it has less crime than about 99% of US cities in our FBI dataset. With a total crime rate of 188.5 per 100,000 residents in 2024, Lindenhurst is relatively safe.
What is the crime rate in Lindenhurst, Illinois?
According to FBI data for 2024, Lindenhurst has a violent crime rate of 34.9 per 100,000 and a property crime rate of 153.6 per 100,000 residents.
How does Lindenhurst compare to the national average?
Lindenhurst's total crime rate of 188.5 per 100,000 can be compared to the national average. The data covers 14,327 residents.
What types of crime are most common in Lindenhurst?
Based on FBI 2024 data, the most reported crimes in Lindenhurst include larceny-theft, aggravated assault, and burglary. Property crime is generally more common than violent crime.
Is Lindenhurst safe to visit?
Like any city, Lindenhurst has areas that are safer than others. The city's overall safety score is 99/100 based on FBI crime data. Standard travel precautions are recommended.