 Violent
 Property
Total
Property
Total
Quick answer
According to crimebycity.com's analysis of FBI 2024 crime data, Kennebunk, ME has a Safety Score of 85/100 — safer than 85% of US cities — with a total crime rate of 697.7 per 100,000 residents, ranking #439 of 2,971 US cities and #5 of 21 in Maine.
Safety Score
Violent Crime Rate
Property Crime Rate
Is Kennebunk, Maine Safe?
Kennebunk, a coastal Maine town settled in 1670, is known for its shipbuilding heritage and picturesque beaches. Its population of around 12,000 residents swells significantly during the summer months due to tourism.
Kennebunk has a safety score of 85/100 (Safer Than Average). Based on FBI data for 2024, the city reported a total crime rate of 697.7 per 100,000 residents, compared to the national average of 2,752.3 per 100,000.
Kennebunk ranks #5 out of 21 cities in Maine and #439 out of 2971 nationally (safest first). This places it in the 85th percentile for safety — safer than 85% of US cities.
Year over year, Kennebunk's total crime rate increased by 50.5%, with violent crime rising 12.6%.
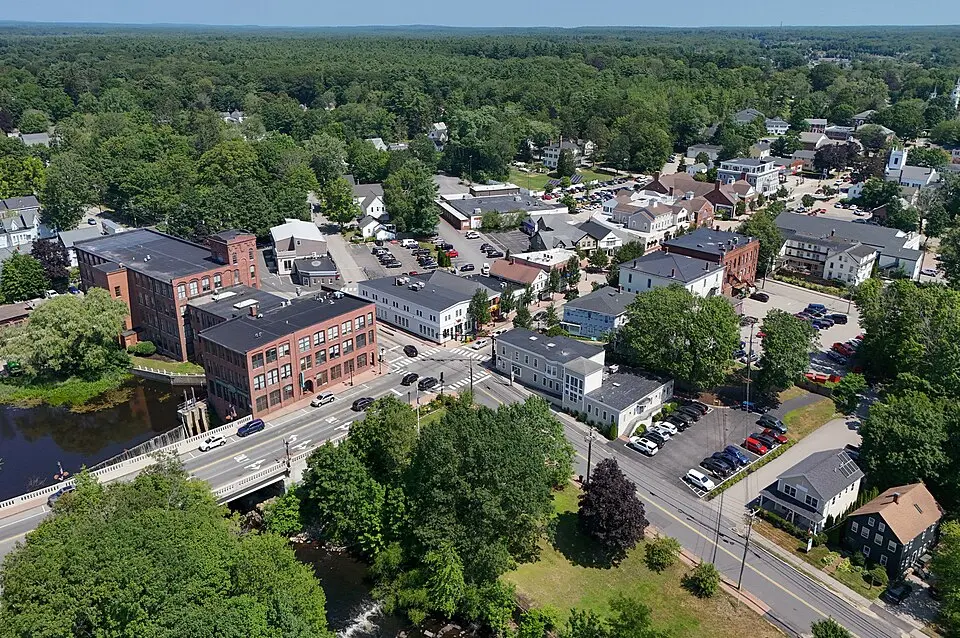
Photo: Wikimedia Commons
Kennebunk Crime Statistics Breakdown (2024)
| Crime Type | Incidents | Rate per 100K | National Avg |
|---|---|---|---|
| Violent Crime | 8 | 66.5 | 473.3 |
| Murder | 0 | 0.0 | 6.2 |
| Rape | 5 | 41.5 | 43.4 |
| Robbery | 0 | 0.0 | 93.0 |
| Aggravated Assault | 3 | 24.9 | 330.0 |
| Property Crime | 76 | 631.2 | 2,279.1 |
| Burglary | 1 | 8.3 | 287.8 |
| Larceny-Theft | 71 | 589.7 | 1,638.9 |
| Motor Vehicle Theft | 4 | 33.2 | 352.4 |
| Arson | 0 | 0.0 | 0.0 |
Kennebunk vs Maine Average
How does Kennebunk's crime rate compare to the Maine state average?
| Metric | Kennebunk | Maine Avg | Difference |
|---|---|---|---|
| Violent Crime Rate | 66.5 | 153.9 | -56.8% |
| Property Crime Rate | 631.2 | 1,833.6 | -65.6% |
| Murder Rate | 0.0 | 4.0 | -100.0% |
| Total Crime Rate | 697.7 | 1,987.5 | -64.9% |
Kennebunk Crime Rate Trends
Year-over-year crime rate changes for Kennebunk, Maine.
| Year | Coverage | Total Crime Rate | Violent Crime Rate | Property Crime Rate |
|---|---|---|---|---|
| 2024 | 12,040 | 697.7 | 66.5 | 631.2 |
| 2023 | 11,863 | 463.6 | 59.0 | 404.6 |
| 2022 | 11,804 | 559.1 | 25.4 | 533.7 |
| 2021 | 11,799 | 500.0 | 50.9 | 449.2 |
| 2020 | 11,719 | 460.8 | 8.5 | 452.3 |
| 2019 | 11,622 | 464.6 | 68.8 | 395.8 |
Frequently Asked Questions
Is Kennebunk, Maine safe?
Kennebunk has a safety score of 85/100, meaning it has less crime than about 85% of US cities in our FBI dataset. With a total crime rate of 697.7 per 100,000 residents in 2024, Kennebunk is relatively safe.
What is the crime rate in Kennebunk, Maine?
According to FBI data for 2024, Kennebunk has a violent crime rate of 66.5 per 100,000 and a property crime rate of 631.2 per 100,000 residents.
How does Kennebunk compare to the national average?
Kennebunk's total crime rate of 697.7 per 100,000 can be compared to the national average. The data covers 12,040 residents.
What types of crime are most common in Kennebunk?
Based on FBI 2024 data, the most reported crimes in Kennebunk include larceny-theft, aggravated assault, and burglary. Property crime is generally more common than violent crime.
Is Kennebunk safe to visit?
Like any city, Kennebunk has areas that are safer than others. The city's overall safety score is 85/100 based on FBI crime data. Standard travel precautions are recommended.