Moving from Kennebunk, ME to Portland, ME?
The Moving Checklist Planner turns your move-in date into a dated checklist, packing inventory and budget — seven tabs for Google Sheets or Excel, $12 once.
Is Kennebunk, ME or Portland, ME Safer?
According to crimebycity.com's analysis of FBI data, Kennebunk, ME is safer than Portland, ME (Safety Score 86/100 vs 24/100), with a total crime rate of 698 per 100,000 versus 2,746 for Portland, ME — 75% lower. Kennebunk has lower rates in 7 of 7 crime categories.
The biggest difference is in murder, where Kennebunk has a 100% lower rate.
Note: Portland is 5.8x larger by coverage, which can affect crime rate comparisons. Larger cities tend to report higher rates due to density and more comprehensive reporting.
Quiz: which of these is SAFER than Kennebunk, ME?
Kennebunk — 5-Year Trend
 Violent
 Property
Total
Portland — 5-Year Trend
Violent
Property
Total
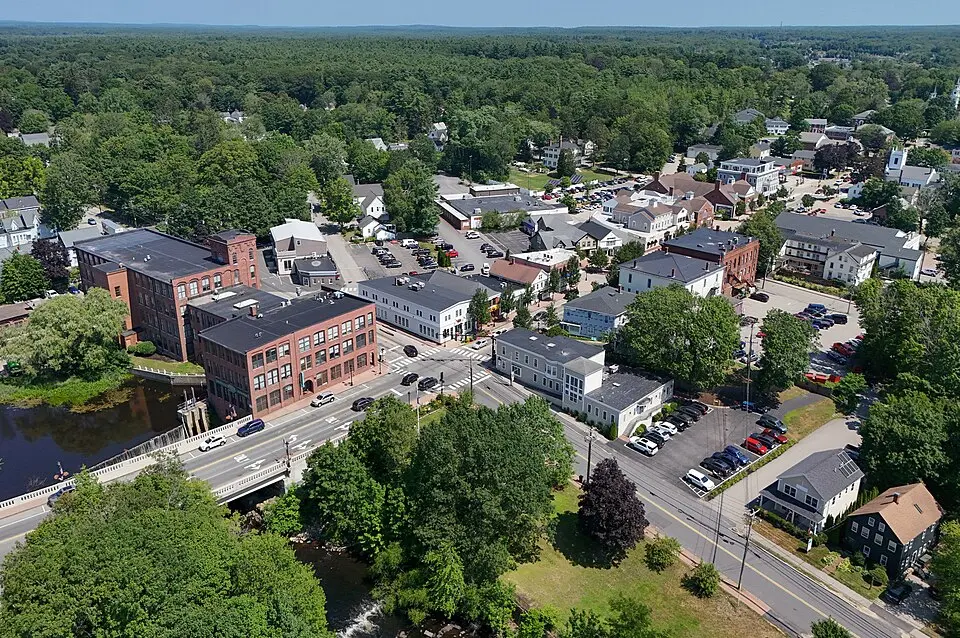
Kennebunk, ME
Portland, ME

Detailed Crime Rate Comparison
| Crime Type | Kennebunk | Portland | Difference |
|---|---|---|---|
| Total Crime Rate | 697.7 | 2,745.6 | -2,048.0 |
| Violent Crime Rate | 66.5 | 266.9 | -200.5 |
| Murder Rate | 0.0 | 7.2 | -7.2 |
| Rape Rate | 41.5 | 41.8 | -0.3 |
| Robbery Rate | 0.0 | 50.5 | -50.5 |
| Aggravated Assault Rate | 24.9 | 167.4 | -142.4 |
| Property Crime Rate | 631.2 | 2,478.7 | -1,847.5 |
| Burglary Rate | 8.3 | 145.7 | -137.4 |
| Larceny-Theft Rate | 589.7 | 2,177.2 | -1,587.5 |
| Motor Vehicle Theft Rate | 33.2 | 155.8 | -122.6 |
All rates per 100,000 residents. Source: FBI UCR.
Moving from Kennebunk, ME to Portland, ME?
The Moving Checklist Planner turns your move-in date into a dated checklist, packing inventory and budget — seven tabs for Google Sheets or Excel, $12 once.
Frequently Asked Questions
Is Kennebunk or Portland safer?
Kennebunk, ME is safer with a total crime rate of 698 per 100K vs 2,746 for Portland, ME — a 75% difference.
How do violent crime rates compare?
Kennebunk has a violent crime rate of 66.5 per 100K while Portland has 266.9. Kennebunk has lower violent crime.
About Kennebunk, ME
Kennebunk, a coastal Maine town settled in 1670, is known for its shipbuilding heritage and picturesque beaches. Its population of around 12,000 residents swells significantly during the summer months due to tourism. With a safety score of 86/100 and a population coverage of 12,040, Kennebunk has a total crime rate of 697.7 per 100,000 residents.
About Portland, ME
Portland, Maine, a coastal city with a deep maritime history, is the most populous city in the state. Its working waterfront and vibrant arts scene reflect its heritage and modern demographic mix. With a safety score of 24/100 and a population coverage of 69,310, Portland has a total crime rate of 2,745.6 per 100,000 residents.