 Violent
 Property
Total
Property
Total
Quick answer
According to crimebycity.com's analysis of FBI 2024 crime data, Davison Township, MI has a Safety Score of 71/100 — safer than 71% of US cities — with a total crime rate of 1,070.9 per 100,000 residents, ranking #851 of 2,971 US cities and #32 of 102 in Michigan.
Safety Score
Violent Crime Rate
Property Crime Rate
Is Davison Township, Michigan Safe?
Davison Township, Michigan, a rural area known for its agricultural roots, is home to a significant number of families and boasts a rich history of community events. It encompasses a diverse landscape, from residential areas to open fields, reflecting its blend of suburban and country living.
Davison Township has a safety score of 71/100 (Safer Than Average). Based on FBI data for 2024, the city reported a total crime rate of 1,070.9 per 100,000 residents, compared to the national average of 2,752.3 per 100,000.
Davison Township ranks #32 out of 102 cities in Michigan and #851 out of 2971 nationally (safest first). This places it in the 71st percentile for safety — safer than 71% of US cities.
All major crime categories in Davison Township are below the national average, with murder particularly low at 0.0x the national rate.
Year over year, Davison Township's total crime rate increased by 24.8%, with violent crime rising 5.8%.
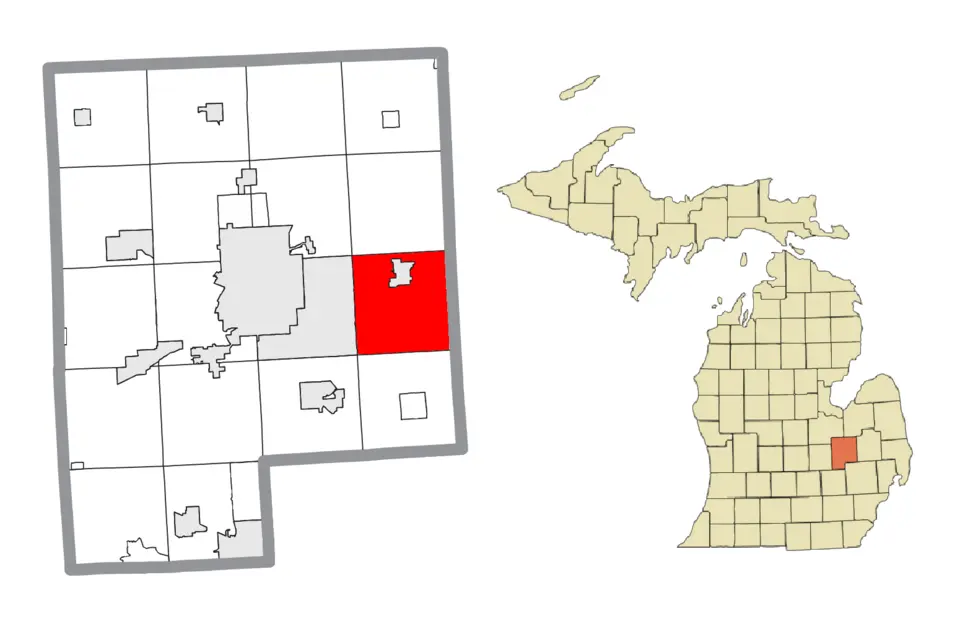
Photo: Wikimedia Commons
Davison Township Crime Statistics Breakdown (2024)
| Crime Type | Incidents | Rate per 100K | National Avg |
|---|---|---|---|
| Violent Crime | 38 | 186.7 | 473.3 |
| Murder | 0 | 0.0 | 6.2 |
| Rape | 4 | 19.7 | 43.4 |
| Robbery | 2 | 9.8 | 93.0 |
| Aggravated Assault | 32 | 157.2 | 330.0 |
| Property Crime | 180 | 884.2 | 2,279.1 |
| Burglary | 7 | 34.4 | 287.8 |
| Larceny-Theft | 159 | 781.1 | 1,638.9 |
| Motor Vehicle Theft | 14 | 68.8 | 352.4 |
| Arson | 0 | 0.0 | 0.0 |
Davison Township vs Michigan Average
How does Davison Township's crime rate compare to the Michigan state average?
| Metric | Davison Township | Michigan Avg | Difference |
|---|---|---|---|
| Violent Crime Rate | 186.7 | 637.8 | -70.7% |
| Property Crime Rate | 884.2 | 1,951.4 | -54.7% |
| Murder Rate | 0.0 | 7.5 | -100.0% |
| Total Crime Rate | 1,070.9 | 2,589.2 | -58.6% |
Davison Township Crime Rate Trends
Year-over-year crime rate changes for Davison Township, Michigan.
| Year | Coverage | Total Crime Rate | Violent Crime Rate | Property Crime Rate |
|---|---|---|---|---|
| 2024 | 20,357 | 1,070.9 | 186.7 | 884.2 |
| 2023 | 20,400 | 857.8 | 176.5 | 681.4 |
| 2022 | 20,452 | 1,281.1 | 249.4 | 1,031.7 |
| 2021 | 19,226 | 1,071.5 | 270.5 | 801.0 |
| 2020 | 19,197 | 1,208.5 | 208.4 | 1,000.2 |
| 2019 | 19,207 | 1,218.3 | 135.4 | 1,082.9 |
Frequently Asked Questions
Is Davison Township, Michigan safe?
Davison Township has a safety score of 71/100, meaning it has less crime than about 71% of US cities in our FBI dataset. With a total crime rate of 1,070.9 per 100,000 residents in 2024, Davison Township is relatively safe.
What is the crime rate in Davison Township, Michigan?
According to FBI data for 2024, Davison Township has a violent crime rate of 186.7 per 100,000 and a property crime rate of 884.2 per 100,000 residents.
How does Davison Township compare to the national average?
Davison Township's total crime rate of 1,070.9 per 100,000 can be compared to the national average. The data covers 20,357 residents.
What types of crime are most common in Davison Township?
Based on FBI 2024 data, the most reported crimes in Davison Township include larceny-theft, aggravated assault, and burglary. Property crime is generally more common than violent crime.
Is Davison Township safe to visit?
Like any city, Davison Township has areas that are safer than others. The city's overall safety score is 71/100 based on FBI crime data. Standard travel precautions are recommended.