 Violent
 Property
Total
Property
Total
Quick answer
According to crimebycity.com's analysis of FBI 2024 crime data, Huron Township, MI has a Safety Score of 84/100 — safer than 84% of US cities — with a total crime rate of 732.8 per 100,000 residents, ranking #482 of 2,971 US cities and #19 of 102 in Michigan.
Safety Score
Violent Crime Rate
Property Crime Rate
Is Huron Township, Michigan Safe?
Huron Township, established in 1827, is a rural community in southeastern Michigan, home to Willow Run Airport. Its landscape is characterized by open spaces and agricultural land, with a population of approximately 16,000 residents.
Huron Township has a safety score of 84/100 (Safer Than Average). Based on FBI data for 2024, the city reported a total crime rate of 732.8 per 100,000 residents, compared to the national average of 2,752.3 per 100,000.
Huron Township ranks #19 out of 102 cities in Michigan and #482 out of 2971 nationally (safest first). This places it in the 84th percentile for safety — safer than 84% of US cities.
The most elevated crime category in Huron Township is rape, at 60.1 per 100K — 1.4x the national average. Conversely, murder is relatively low at just 0.0x the national rate.
Year over year, Huron Township's total crime rate decreased by 16.9%, with violent crime declining 26.7%.
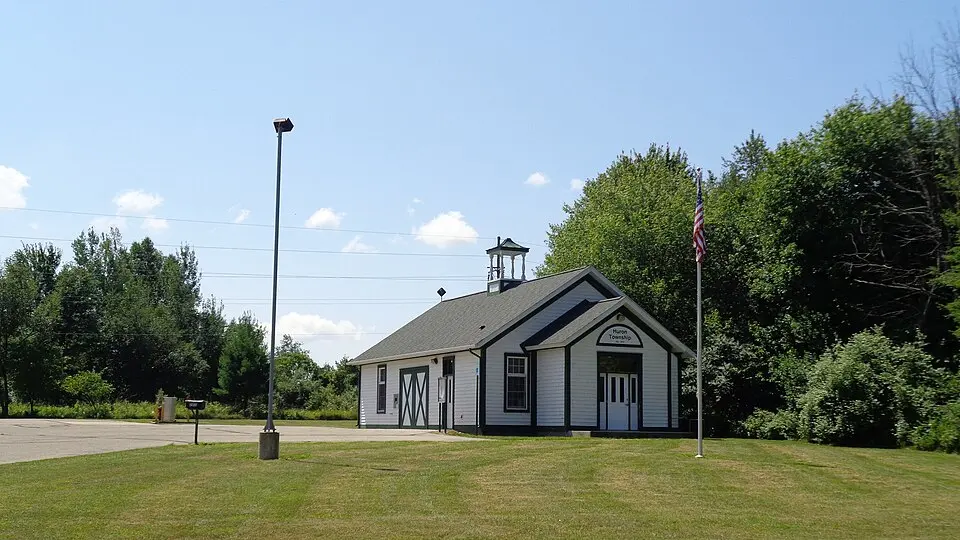
Photo: Wikimedia Commons
Huron Township Crime Statistics Breakdown (2024)
| Crime Type | Incidents | Rate per 100K | National Avg |
|---|---|---|---|
| Violent Crime | 39 | 234.3 | 473.3 |
| Murder | 0 | 0.0 | 6.2 |
| Rape | 10 | 60.1 | 43.4 |
| Robbery | 0 | 0.0 | 93.0 |
| Aggravated Assault | 29 | 174.2 | 330.0 |
| Property Crime | 83 | 498.6 | 2,279.1 |
| Burglary | 16 | 96.1 | 287.8 |
| Larceny-Theft | 55 | 330.4 | 1,638.9 |
| Motor Vehicle Theft | 12 | 72.1 | 352.4 |
| Arson | 0 | 0.0 | 0.0 |
Huron Township vs Michigan Average
How does Huron Township's crime rate compare to the Michigan state average?
| Metric | Huron Township | Michigan Avg | Difference |
|---|---|---|---|
| Violent Crime Rate | 234.3 | 637.8 | -63.3% |
| Property Crime Rate | 498.6 | 1,951.4 | -74.5% |
| Murder Rate | 0.0 | 7.5 | -100.0% |
| Total Crime Rate | 732.8 | 2,589.2 | -71.7% |
Huron Township Crime Rate Trends
Year-over-year crime rate changes for Huron Township, Michigan.
| Year | Coverage | Total Crime Rate | Violent Crime Rate | Property Crime Rate |
|---|---|---|---|---|
| 2024 | 16,648 | 732.8 | 234.3 | 498.6 |
| 2023 | 16,894 | 882.0 | 319.6 | 562.3 |
| 2022 | 16,837 | 1,045.3 | 445.5 | 599.9 |
| 2021 | 16,353 | 801.1 | 220.1 | 580.9 |
| 2020 | 16,288 | 810.4 | 208.7 | 601.7 |
| 2019 | 16,089 | 820.4 | 161.6 | 658.8 |
Frequently Asked Questions
Is Huron Township, Michigan safe?
Huron Township has a safety score of 84/100, meaning it has less crime than about 84% of US cities in our FBI dataset. With a total crime rate of 732.8 per 100,000 residents in 2024, Huron Township is relatively safe.
What is the crime rate in Huron Township, Michigan?
According to FBI data for 2024, Huron Township has a violent crime rate of 234.3 per 100,000 and a property crime rate of 498.6 per 100,000 residents.
How does Huron Township compare to the national average?
Huron Township's total crime rate of 732.8 per 100,000 can be compared to the national average. The data covers 16,648 residents.
What types of crime are most common in Huron Township?
Based on FBI 2024 data, the most reported crimes in Huron Township include larceny-theft, aggravated assault, and burglary. Property crime is generally more common than violent crime.
Is Huron Township safe to visit?
Like any city, Huron Township has areas that are safer than others. The city's overall safety score is 84/100 based on FBI crime data. Standard travel precautions are recommended.