 Violent
 Property
 Total
Total
Quick answer
According to crimebycity.com's analysis of FBI 2024 crime data, Waterford Township, MI has a Safety Score of 70/100 — safer than 70% of US cities — with a total crime rate of 1,109.1 per 100,000 residents, ranking #897 of 2,971 US cities and #34 of 102 in Michigan.
Safety Score
Violent Crime Rate
Property Crime Rate
Is Waterford Township, Michigan Safe?
Waterford Township, Michigan, a large charter township in Oakland County, encompasses over 20 named lakes, providing a significant recreational draw. Historically, it was a major lumbering center in the 19th century.
Waterford Township has a safety score of 70/100 (Safer Than Average). Based on FBI data for 2024, the city reported a total crime rate of 1,109.1 per 100,000 residents, compared to the national average of 2,752.3 per 100,000.
Waterford Township ranks #34 out of 102 cities in Michigan and #897 out of 2971 nationally (safest first). This places it in the 70th percentile for safety — safer than 70% of US cities.
All major crime categories in Waterford Township are below the national average, with robbery particularly low at 0.1x the national rate.
Year over year, Waterford Township's total crime rate increased by 2.3%.
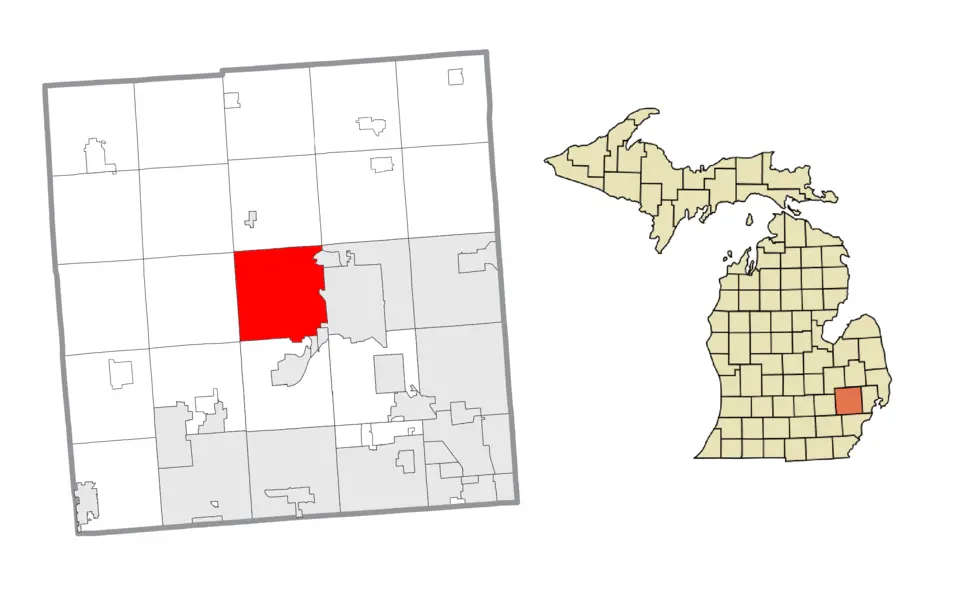
Photo: Wikimedia Commons
Waterford Township Crime Statistics Breakdown (2024)
| Crime Type | Incidents | Rate per 100K | National Avg |
|---|---|---|---|
| Violent Crime | 193 | 279.4 | 473.3 |
| Murder | 1 | 1.5 | 6.2 |
| Rape | 22 | 31.9 | 43.4 |
| Robbery | 6 | 8.7 | 93.0 |
| Aggravated Assault | 164 | 237.5 | 330.0 |
| Property Crime | 573 | 829.6 | 2,279.1 |
| Burglary | 127 | 183.9 | 287.8 |
| Larceny-Theft | 343 | 496.6 | 1,638.9 |
| Motor Vehicle Theft | 103 | 149.1 | 352.4 |
| Arson | 0 | 0.0 | 0.0 |
Waterford Township vs Michigan Average
How does Waterford Township's crime rate compare to the Michigan state average?
| Metric | Waterford Township | Michigan Avg | Difference |
|---|---|---|---|
| Violent Crime Rate | 279.4 | 637.8 | -56.2% |
| Property Crime Rate | 829.6 | 1,951.4 | -57.5% |
| Murder Rate | 1.5 | 7.5 | -80.7% |
| Total Crime Rate | 1,109.1 | 2,589.2 | -57.2% |
Waterford Township Crime Rate Trends
Year-over-year crime rate changes for Waterford Township, Michigan.
| Year | Coverage | Total Crime Rate | Violent Crime Rate | Property Crime Rate |
|---|---|---|---|---|
| 2024 | 69,066 | 1,109.1 | 279.4 | 829.6 |
| 2023 | 69,153 | 1,084.6 | 277.7 | 806.9 |
| 2022 | 69,851 | 1,118.1 | 233.4 | 884.7 |
| 2021 | 72,213 | 1,004.0 | 218.8 | 785.2 |
| 2020 | 72,735 | 1,011.9 | 231.0 | 780.9 |
| 2019 | 73,105 | 1,069.7 | 186.0 | 883.7 |
Frequently Asked Questions
Is Waterford Township, Michigan safe?
Waterford Township has a safety score of 70/100, meaning it has less crime than about 70% of US cities in our FBI dataset. With a total crime rate of 1,109.1 per 100,000 residents in 2024, Waterford Township is relatively safe.
What is the crime rate in Waterford Township, Michigan?
According to FBI data for 2024, Waterford Township has a violent crime rate of 279.4 per 100,000 and a property crime rate of 829.6 per 100,000 residents.
How does Waterford Township compare to the national average?
Waterford Township's total crime rate of 1,109.1 per 100,000 can be compared to the national average. The data covers 69,066 residents.
What types of crime are most common in Waterford Township?
Based on FBI 2024 data, the most reported crimes in Waterford Township include larceny-theft, aggravated assault, and burglary. Property crime is generally more common than violent crime.
Is Waterford Township safe to visit?
Like any city, Waterford Township has areas that are safer than others. The city's overall safety score is 70/100 based on FBI crime data. Standard travel precautions are recommended.