 Violent
 Property
Total
Property
Total
Quick answer
According to crimebycity.com's analysis of FBI 2024 crime data, Kirkwood, MO has a Safety Score of 52/100 — safer than 52% of US cities — with a total crime rate of 1,609.2 per 100,000 residents, ranking #1,416 of 2,971 US cities and #33 of 70 in Missouri.
Safety Score
Violent Crime Rate
Property Crime Rate
Is Kirkwood, Missouri Safe?
Kirkwood, a suburban city in St. Louis County, is home to the historic Kirkwood Farmers' Market, established in 1974. Its tree-lined streets and older housing stock contribute to its established, residential character.
Kirkwood has a safety score of 52/100 (Near National Average). Based on FBI data for 2024, the city reported a total crime rate of 1,609.2 per 100,000 residents, compared to the national average of 2,752.3 per 100,000.
Kirkwood ranks #33 out of 70 cities in Missouri and #1416 out of 2971 nationally (safest first). This places it in the 52nd percentile for safety — safer than 52% of US cities.
All major crime categories in Kirkwood are below the national average, with murder particularly low at 0.0x the national rate.
Year over year, Kirkwood's total crime rate decreased by 2.7%, with violent crime rising 32.4%.
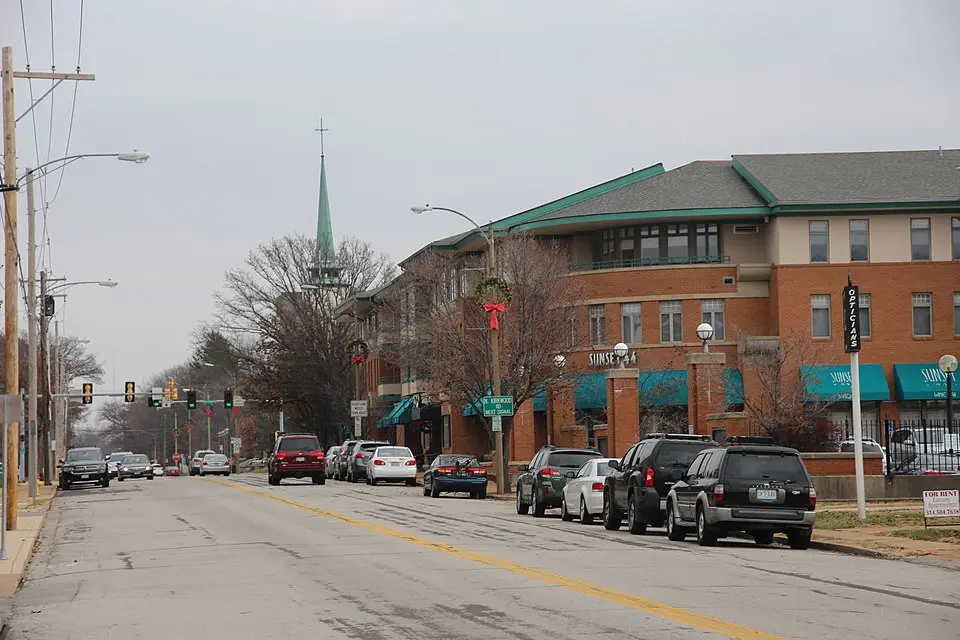
Photo: Wikimedia Commons
Kirkwood Crime Statistics Breakdown (2024)
| Crime Type | Incidents | Rate per 100K | National Avg |
|---|---|---|---|
| Violent Crime | 62 | 213.2 | 473.3 |
| Murder | 0 | 0.0 | 6.2 |
| Rape | 6 | 20.6 | 43.4 |
| Robbery | 4 | 13.8 | 93.0 |
| Aggravated Assault | 52 | 178.8 | 330.0 |
| Property Crime | 406 | 1,396.1 | 2,279.1 |
| Burglary | 24 | 82.5 | 287.8 |
| Larceny-Theft | 348 | 1,196.6 | 1,638.9 |
| Motor Vehicle Theft | 34 | 116.9 | 352.4 |
| Arson | 0 | 0.0 | 0.0 |
Kirkwood vs Missouri Average
How does Kirkwood's crime rate compare to the Missouri state average?
| Metric | Kirkwood | Missouri Avg | Difference |
|---|---|---|---|
| Violent Crime Rate | 213.2 | 679.8 | -68.6% |
| Property Crime Rate | 1,396.1 | 2,941.8 | -52.5% |
| Murder Rate | 0.0 | 12.9 | -100.0% |
| Total Crime Rate | 1,609.2 | 3,621.5 | -55.6% |
Kirkwood Crime Rate Trends
Year-over-year crime rate changes for Kirkwood, Missouri.
| Year | Coverage | Total Crime Rate | Violent Crime Rate | Property Crime Rate |
|---|---|---|---|---|
| 2024 | 29,082 | 1,609.2 | 213.2 | 1,396.1 |
| 2023 | 29,193 | 1,654.5 | 161.0 | 1,493.5 |
| 2022 | 29,276 | 1,906.0 | 143.5 | 1,762.5 |
| 2021 | 27,897 | 1,742.1 | 172.1 | 1,570.1 |
| 2020 | 27,834 | 1,958.0 | 158.1 | 1,800.0 |
Frequently Asked Questions
Is Kirkwood, Missouri safe?
Kirkwood has a safety score of 52/100, meaning it has less crime than about 52% of US cities in our FBI dataset. With a total crime rate of 1,609.2 per 100,000 residents in 2024, Kirkwood is about average for a US city.
What is the crime rate in Kirkwood, Missouri?
According to FBI data for 2024, Kirkwood has a violent crime rate of 213.2 per 100,000 and a property crime rate of 1,396.1 per 100,000 residents.
How does Kirkwood compare to the national average?
Kirkwood's total crime rate of 1,609.2 per 100,000 can be compared to the national average. The data covers 29,082 residents.
What types of crime are most common in Kirkwood?
Based on FBI 2024 data, the most reported crimes in Kirkwood include larceny-theft, aggravated assault, and burglary. Property crime is generally more common than violent crime.
Is Kirkwood safe to visit?
Like any city, Kirkwood has areas that are safer than others. The city's overall safety score is 52/100 based on FBI crime data. Standard travel precautions are recommended.