 Violent
 Property
Total
Property
Total
Quick answer
According to crimebycity.com's analysis of FBI 2024 crime data, Portsmouth, NH has a Safety Score of 57/100 — safer than 57% of US cities — with a total crime rate of 1,475.9 per 100,000 residents, ranking #1,279 of 2,971 US cities and #21 of 29 in New Hampshire.
Safety Score
Violent Crime Rate
Property Crime Rate
Is Portsmouth, New Hampshire Safe?
Portsmouth, a historic port city on the Piscataqua River, boasts a vibrant arts scene and charming 17th-century architecture. Its compact downtown, home to many independent businesses, makes it a walkable destination.
Portsmouth has a safety score of 57/100 (Near National Average). Based on FBI data for 2024, the city reported a total crime rate of 1,475.9 per 100,000 residents, compared to the national average of 2,752.3 per 100,000.
Portsmouth ranks #21 out of 29 cities in New Hampshire and #1279 out of 2971 nationally (safest first). This places it in the 57th percentile for safety — safer than 57% of US cities.
Year over year, Portsmouth's total crime rate increased by 25.1%, with violent crime rising 33.8%.
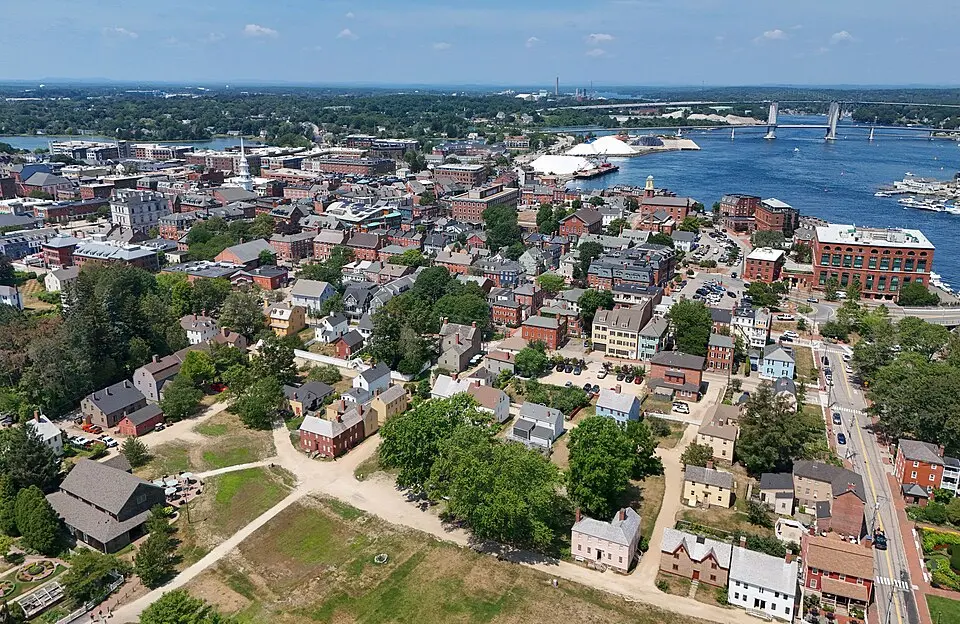
Photo: Wikimedia Commons
Portsmouth Crime Statistics Breakdown (2024)
| Crime Type | Incidents | Rate per 100K | National Avg |
|---|---|---|---|
| Violent Crime | 44 | 191.6 | 473.3 |
| Murder | 0 | 0.0 | 6.2 |
| Rape | 9 | 39.2 | 43.4 |
| Robbery | 2 | 8.7 | 93.0 |
| Aggravated Assault | 32 | 139.3 | 330.0 |
| Property Crime | 295 | 1,284.3 | 2,279.1 |
| Burglary | 7 | 30.5 | 287.8 |
| Larceny-Theft | 265 | 1,153.7 | 1,638.9 |
| Motor Vehicle Theft | 23 | 100.1 | 352.4 |
| Arson | 0 | 0.0 | 0.0 |
Portsmouth vs New Hampshire Average
How does Portsmouth's crime rate compare to the New Hampshire state average?
| Metric | Portsmouth | New Hampshire Avg | Difference |
|---|---|---|---|
| Violent Crime Rate | 191.6 | 133.2 | +43.9% |
| Property Crime Rate | 1,284.3 | 1,158.9 | +10.8% |
| Murder Rate | 0.0 | 1.2 | -100.0% |
| Total Crime Rate | 1,475.9 | 1,292.0 | +14.2% |
Portsmouth Crime Rate Trends
Year-over-year crime rate changes for Portsmouth, New Hampshire.
| Year | Coverage | Total Crime Rate | Violent Crime Rate | Property Crime Rate |
|---|---|---|---|---|
| 2024 | 22,969 | 1,475.9 | 191.6 | 1,284.3 |
| 2023 | 23,057 | 1,179.7 | 143.1 | 1,036.6 |
| 2022 | 22,513 | 1,439.2 | 186.6 | 1,252.6 |
| 2021 | 21,913 | 1,729.6 | 251.0 | 1,478.6 |
| 2020 | 22,032 | 1,257.3 | 122.6 | 1,134.7 |
| 2019 | 21,951 | 1,763.0 | 127.6 | 1,635.5 |
Frequently Asked Questions
Is Portsmouth, New Hampshire safe?
Portsmouth has a safety score of 57/100, meaning it has less crime than about 57% of US cities in our FBI dataset. With a total crime rate of 1,475.9 per 100,000 residents in 2024, Portsmouth is about average for a US city.
What is the crime rate in Portsmouth, New Hampshire?
According to FBI data for 2024, Portsmouth has a violent crime rate of 191.6 per 100,000 and a property crime rate of 1,284.3 per 100,000 residents.
How does Portsmouth compare to the national average?
Portsmouth's total crime rate of 1,475.9 per 100,000 can be compared to the national average. The data covers 22,969 residents.
What types of crime are most common in Portsmouth?
Based on FBI 2024 data, the most reported crimes in Portsmouth include larceny-theft, aggravated assault, and burglary. Property crime is generally more common than violent crime.
Is Portsmouth safe to visit?
Like any city, Portsmouth has areas that are safer than others. The city's overall safety score is 57/100 based on FBI crime data. Standard travel precautions are recommended.