 Violent
Property
Total
Violent
Property
Total
Quick answer
According to crimebycity.com's analysis of FBI 2024 crime data, Salem, NH has a Safety Score of 38/100 — higher crime than 62% of US cities — with a total crime rate of 2,074.3 per 100,000 residents, ranking #1,836 of 2,971 US cities and #25 of 29 in New Hampshire.
Safety Score
Violent Crime Rate
Property Crime Rate
Is Salem, New Hampshire Safe?
Salem, NH, once home to America's first continuously operated amusement park, is a southern New Hampshire town bordering Massachusetts. Its population is primarily white and has grown steadily over the past few decades.
Salem has a safety score of 38/100 (Higher Crime Than Average). Based on FBI data for 2024, the city reported a total crime rate of 2,074.3 per 100,000 residents, compared to the national average of 2,752.3 per 100,000.
Salem ranks #25 out of 29 cities in New Hampshire and #1836 out of 2971 nationally (safest first). This places it in the 38th percentile for safety — with higher crime than 62% of US cities.
Year over year, Salem's total crime rate increased by 17.6%, with violent crime declining 20.1%.
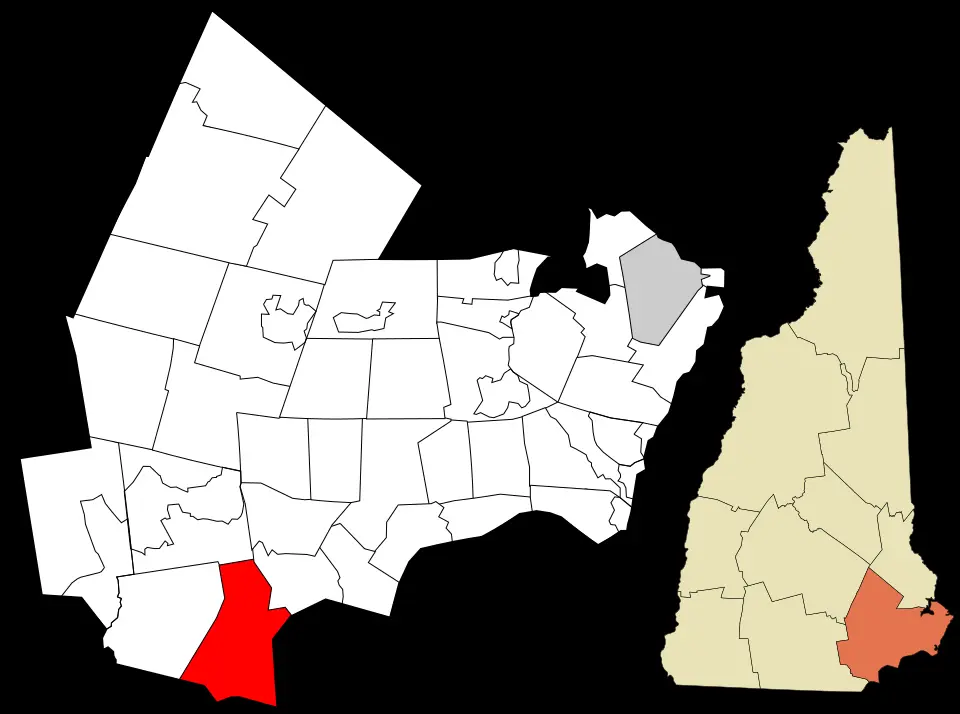
Photo: Wikimedia Commons
Salem Crime Statistics Breakdown (2024)
| Crime Type | Incidents | Rate per 100K | National Avg |
|---|---|---|---|
| Violent Crime | 34 | 106.4 | 473.3 |
| Murder | 1 | 3.1 | 6.2 |
| Rape | 8 | 25.0 | 43.4 |
| Robbery | 15 | 46.9 | 93.0 |
| Aggravated Assault | 10 | 31.3 | 330.0 |
| Property Crime | 629 | 1,968.0 | 2,279.1 |
| Burglary | 20 | 62.6 | 287.8 |
| Larceny-Theft | 582 | 1,820.9 | 1,638.9 |
| Motor Vehicle Theft | 27 | 84.5 | 352.4 |
| Arson | 0 | 0.0 | 0.0 |
Salem vs New Hampshire Average
How does Salem's crime rate compare to the New Hampshire state average?
| Metric | Salem | New Hampshire Avg | Difference |
|---|---|---|---|
| Violent Crime Rate | 106.4 | 133.2 | -20.1% |
| Property Crime Rate | 1,968.0 | 1,158.9 | +69.8% |
| Murder Rate | 3.1 | 1.2 | +167.5% |
| Total Crime Rate | 2,074.3 | 1,292.0 | +60.6% |
Salem Crime Rate Trends
Year-over-year crime rate changes for Salem, New Hampshire.
| Year | Coverage | Total Crime Rate | Violent Crime Rate | Property Crime Rate |
|---|---|---|---|---|
| 2024 | 31,962 | 2,074.3 | 106.4 | 1,968.0 |
| 2023 | 30,796 | 1,763.2 | 133.1 | 1,630.1 |
| 2022 | 30,712 | 1,514.1 | 94.4 | 1,419.6 |
| 2021 | 31,231 | 1,133.5 | 51.2 | 1,082.3 |
| 2020 | 29,943 | 1,175.6 | 70.1 | 1,105.4 |
| 2019 | 29,612 | 1,597.3 | 84.4 | 1,512.9 |
Frequently Asked Questions
Is Salem, New Hampshire safe?
Salem has a safety score of 38/100, meaning it has less crime than about 38% of US cities in our FBI dataset. With a total crime rate of 2,074.3 per 100,000 residents in 2024, Salem is higher-crime than most US cities.
What is the crime rate in Salem, New Hampshire?
According to FBI data for 2024, Salem has a violent crime rate of 106.4 per 100,000 and a property crime rate of 1,968.0 per 100,000 residents.
How does Salem compare to the national average?
Salem's total crime rate of 2,074.3 per 100,000 can be compared to the national average. The data covers 31,962 residents.
What types of crime are most common in Salem?
Based on FBI 2024 data, the most reported crimes in Salem include larceny-theft, aggravated assault, and burglary. Property crime is generally more common than violent crime.
Is Salem safe to visit?
Like any city, Salem has areas that are safer than others. The city's overall safety score is 38/100 based on FBI crime data. Standard travel precautions are recommended.