 Violent
Property
Total
Violent
Property
Total
Quick answer
According to crimebycity.com's analysis of FBI 2024 crime data, Lebanon, TN has a Safety Score of 60/100 — safer than 60% of US cities — with a total crime rate of 1,380.4 per 100,000 residents, ranking #1,178 of 2,971 US cities and #18 of 59 in Tennessee.
Safety Score
Violent Crime Rate
Property Crime Rate
Is Lebanon, Tennessee Safe?
Lebanon, TN, county seat of Wilson County, is a city of over 40,000 residents known for its annual Wilson County Fair. Situated about 30 miles east of Nashville, it serves as a regional hub for commerce and healthcare.
Lebanon has a safety score of 60/100 (Near National Average). Based on FBI data for 2024, the city reported a total crime rate of 1,380.4 per 100,000 residents, compared to the national average of 2,752.3 per 100,000.
Lebanon ranks #18 out of 59 cities in Tennessee and #1178 out of 2971 nationally (safest first). This places it in the 60th percentile for safety — safer than 60% of US cities.
Year over year, Lebanon's total crime rate decreased by 29.3%, with violent crime declining 14.1%.
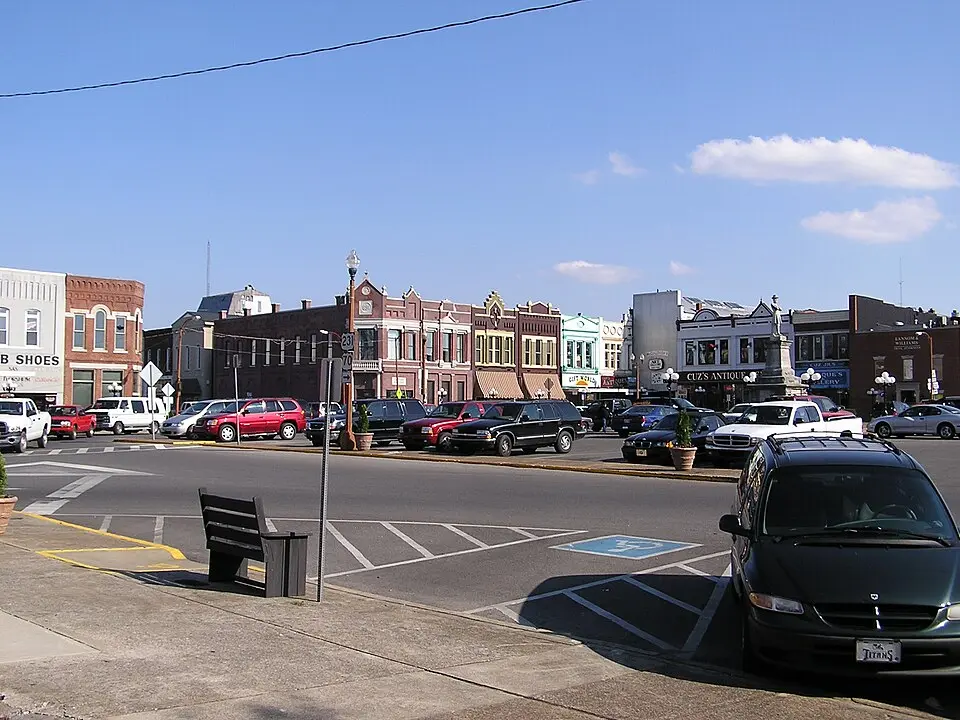
Photo: Wikimedia Commons
Lebanon Crime Statistics Breakdown (2024)
| Crime Type | Incidents | Rate per 100K | National Avg |
|---|---|---|---|
| Violent Crime | 179 | 346.5 | 473.3 |
| Murder | 3 | 5.8 | 6.2 |
| Rape | 19 | 36.8 | 43.4 |
| Robbery | 5 | 9.7 | 93.0 |
| Aggravated Assault | 151 | 292.3 | 330.0 |
| Property Crime | 534 | 1,033.8 | 2,279.1 |
| Burglary | 70 | 135.5 | 287.8 |
| Larceny-Theft | 415 | 803.4 | 1,638.9 |
| Motor Vehicle Theft | 49 | 94.9 | 352.4 |
| Arson | 0 | 0.0 | 0.0 |
Lebanon vs Tennessee Average
How does Lebanon's crime rate compare to the Tennessee state average?
| Metric | Lebanon | Tennessee Avg | Difference |
|---|---|---|---|
| Violent Crime Rate | 346.5 | 916.8 | -62.2% |
| Property Crime Rate | 1,033.8 | 3,281.7 | -68.5% |
| Murder Rate | 5.8 | 13.0 | -55.4% |
| Total Crime Rate | 1,380.4 | 4,198.5 | -67.1% |
Lebanon Crime Rate Trends
Year-over-year crime rate changes for Lebanon, Tennessee.
| Year | Coverage | Total Crime Rate | Violent Crime Rate | Property Crime Rate |
|---|---|---|---|---|
| 2024 | 51,653 | 1,380.4 | 346.5 | 1,033.8 |
| 2023 | 47,083 | 1,951.9 | 403.5 | 1,548.3 |
| 2022 | 43,321 | 2,100.6 | 457.1 | 1,643.5 |
| 2021 | 39,524 | 2,307.5 | 470.6 | 1,836.9 |
| 2020 | 37,832 | 3,394.0 | 576.2 | 2,817.7 |
| 2019 | 36,337 | 2,966.7 | 410.1 | 2,556.6 |
Frequently Asked Questions
Is Lebanon, Tennessee safe?
Lebanon has a safety score of 60/100, meaning it has less crime than about 60% of US cities in our FBI dataset. With a total crime rate of 1,380.4 per 100,000 residents in 2024, Lebanon is about average for a US city.
What is the crime rate in Lebanon, Tennessee?
According to FBI data for 2024, Lebanon has a violent crime rate of 346.5 per 100,000 and a property crime rate of 1,033.8 per 100,000 residents.
How does Lebanon compare to the national average?
Lebanon's total crime rate of 1,380.4 per 100,000 can be compared to the national average. The data covers 51,653 residents.
What types of crime are most common in Lebanon?
Based on FBI 2024 data, the most reported crimes in Lebanon include larceny-theft, aggravated assault, and burglary. Property crime is generally more common than violent crime.
Is Lebanon safe to visit?
Like any city, Lebanon has areas that are safer than others. The city's overall safety score is 60/100 based on FBI crime data. Standard travel precautions are recommended.