 Violent
 Property
Total
Property
Total
Quick answer
According to crimebycity.com's analysis of FBI 2024 crime data, Spanish Fork, UT has a Safety Score of 82/100 — safer than 82% of US cities — with a total crime rate of 780.0 per 100,000 residents, ranking #529 of 2,971 US cities and #14 of 48 in Utah.
Safety Score
Violent Crime Rate
Property Crime Rate
Is Spanish Fork, Utah Safe?
Spanish Fork, a city in Utah County, sits at the base of the Wasatch Mountains. Founded by Mormon pioneers, it hosts an annual Fiesta Days rodeo, reflecting its agricultural heritage. The community is predominantly suburban, experiencing steady population growth.
Spanish Fork has a safety score of 82/100 (Safer Than Average). Based on FBI data for 2024, the city reported a total crime rate of 780.0 per 100,000 residents, compared to the national average of 2,752.3 per 100,000.
Spanish Fork ranks #14 out of 48 cities in Utah and #529 out of 2971 nationally (safest first). This places it in the 82nd percentile for safety — safer than 82% of US cities.
Year over year, Spanish Fork's total crime rate decreased by 20.4%, with violent crime declining 3.7%.
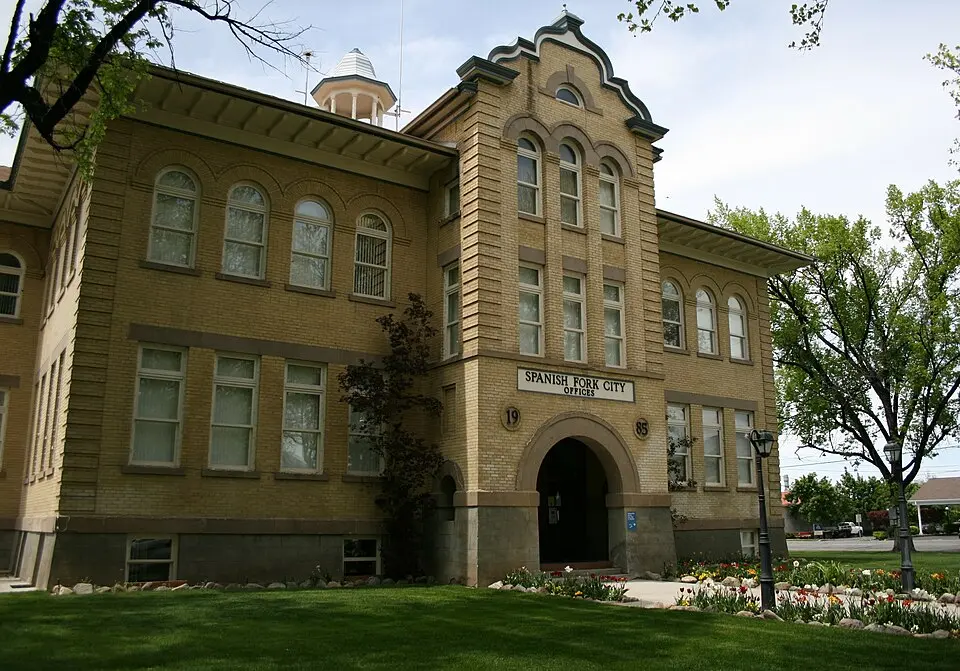
Photo: Wikimedia Commons
Spanish Fork Crime Statistics Breakdown (2024)
| Crime Type | Incidents | Rate per 100K | National Avg |
|---|---|---|---|
| Violent Crime | 35 | 75.2 | 473.3 |
| Murder | 0 | 0.0 | 6.2 |
| Rape | 17 | 36.5 | 43.4 |
| Robbery | 0 | 0.0 | 93.0 |
| Aggravated Assault | 18 | 38.7 | 330.0 |
| Property Crime | 328 | 704.8 | 2,279.1 |
| Burglary | 25 | 53.7 | 287.8 |
| Larceny-Theft | 288 | 618.9 | 1,638.9 |
| Motor Vehicle Theft | 15 | 32.2 | 352.4 |
| Arson | 0 | 0.0 | 0.0 |
Spanish Fork vs Utah Average
How does Spanish Fork's crime rate compare to the Utah state average?
| Metric | Spanish Fork | Utah Avg | Difference |
|---|---|---|---|
| Violent Crime Rate | 75.2 | 267.1 | -71.8% |
| Property Crime Rate | 704.8 | 1,597.0 | -55.9% |
| Murder Rate | 0.0 | 2.5 | -100.0% |
| Total Crime Rate | 780.0 | 1,864.1 | -58.2% |
Spanish Fork Crime Rate Trends
Year-over-year crime rate changes for Spanish Fork, Utah.
| Year | Coverage | Total Crime Rate | Violent Crime Rate | Property Crime Rate |
|---|---|---|---|---|
| 2024 | 46,536 | 780.0 | 75.2 | 704.8 |
| 2023 | 44,805 | 979.8 | 78.1 | 901.7 |
| 2022 | 45,005 | 1,093.2 | 91.1 | 1,002.1 |
| 2021 | 41,931 | 1,104.2 | 64.4 | 1,039.8 |
| 2020 | 41,605 | 1,206.6 | 76.9 | 1,129.7 |
| 2019 | 40,604 | 834.9 | 17.2 | 817.7 |
Frequently Asked Questions
Is Spanish Fork, Utah safe?
Spanish Fork has a safety score of 82/100, meaning it has less crime than about 82% of US cities in our FBI dataset. With a total crime rate of 780.0 per 100,000 residents in 2024, Spanish Fork is relatively safe.
What is the crime rate in Spanish Fork, Utah?
According to FBI data for 2024, Spanish Fork has a violent crime rate of 75.2 per 100,000 and a property crime rate of 704.8 per 100,000 residents.
How does Spanish Fork compare to the national average?
Spanish Fork's total crime rate of 780.0 per 100,000 can be compared to the national average. The data covers 46,536 residents.
What types of crime are most common in Spanish Fork?
Based on FBI 2024 data, the most reported crimes in Spanish Fork include larceny-theft, aggravated assault, and burglary. Property crime is generally more common than violent crime.
Is Spanish Fork safe to visit?
Like any city, Spanish Fork has areas that are safer than others. The city's overall safety score is 82/100 based on FBI crime data. Standard travel precautions are recommended.