 Violent
 Property
Total
Property
Total
Quick answer
According to crimebycity.com's analysis of FBI 2024 crime data, Falls Church, VA has a Safety Score of 52/100 — safer than 52% of US cities — with a total crime rate of 1,621.5 per 100,000 residents, ranking #1,428 of 2,971 US cities and #9 of 38 in Virginia.
Safety Score
Violent Crime Rate
Property Crime Rate
Is Falls Church, Virginia Safe?
Falls Church, Virginia, an independent city since 1948, is a small, densely populated urban area in Northern Virginia. Its historic Falls Church Episcopal church dates to the 1700s, and it's known for its suburban charm and proximity to Washington D.C.
Falls Church has a safety score of 52/100 (Near National Average). Based on FBI data for 2024, the city reported a total crime rate of 1,621.5 per 100,000 residents, compared to the national average of 2,752.3 per 100,000.
Falls Church ranks #9 out of 38 cities in Virginia and #1428 out of 2971 nationally (safest first). This places it in the 52nd percentile for safety — safer than 52% of US cities.
Year over year, Falls Church's total crime rate decreased by 15.4%, with violent crime declining 18.1%.
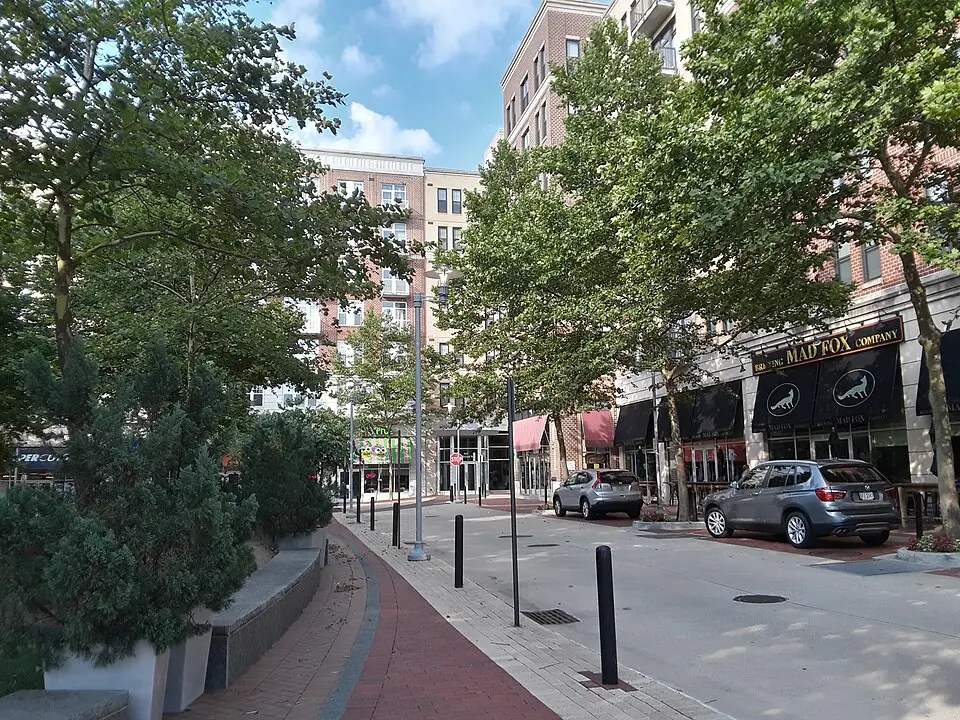
Photo: Wikimedia Commons
Falls Church Crime Statistics Breakdown (2024)
| Crime Type | Incidents | Rate per 100K | National Avg |
|---|---|---|---|
| Violent Crime | 15 | 101.3 | 473.3 |
| Murder | 0 | 0.0 | 6.2 |
| Rape | 0 | 0.0 | 43.4 |
| Robbery | 7 | 47.3 | 93.0 |
| Aggravated Assault | 8 | 54.1 | 330.0 |
| Property Crime | 225 | 1,520.2 | 2,279.1 |
| Burglary | 12 | 81.1 | 287.8 |
| Larceny-Theft | 197 | 1,331.0 | 1,638.9 |
| Motor Vehicle Theft | 16 | 108.1 | 352.4 |
| Arson | 0 | 0.0 | 0.0 |
Falls Church vs Virginia Average
How does Falls Church's crime rate compare to the Virginia state average?
| Metric | Falls Church | Virginia Avg | Difference |
|---|---|---|---|
| Violent Crime Rate | 101.3 | 338.9 | -70.1% |
| Property Crime Rate | 1,520.2 | 2,386.6 | -36.3% |
| Murder Rate | 0.0 | 9.8 | -100.0% |
| Total Crime Rate | 1,621.5 | 2,725.5 | -40.5% |
Falls Church Crime Rate Trends
Year-over-year crime rate changes for Falls Church, Virginia.
| Year | Coverage | Total Crime Rate | Violent Crime Rate | Property Crime Rate |
|---|---|---|---|---|
| 2024 | 14,801 | 1,621.5 | 101.3 | 1,520.2 |
| 2023 | 14,553 | 1,917.1 | 123.7 | 1,793.4 |
| 2022 | 14,384 | 1,800.6 | 55.6 | 1,745.0 |
| 2021 | 14,856 | 1,379.9 | 101.0 | 1,278.9 |
| 2020 | 14,877 | 1,626.7 | 141.2 | 1,485.5 |
| 2019 | 15,008 | 1,599.2 | 66.6 | 1,532.5 |
Frequently Asked Questions
Is Falls Church, Virginia safe?
Falls Church has a safety score of 52/100, meaning it has less crime than about 52% of US cities in our FBI dataset. With a total crime rate of 1,621.5 per 100,000 residents in 2024, Falls Church is about average for a US city.
What is the crime rate in Falls Church, Virginia?
According to FBI data for 2024, Falls Church has a violent crime rate of 101.3 per 100,000 and a property crime rate of 1,520.2 per 100,000 residents.
How does Falls Church compare to the national average?
Falls Church's total crime rate of 1,621.5 per 100,000 can be compared to the national average. The data covers 14,801 residents.
What types of crime are most common in Falls Church?
Based on FBI 2024 data, the most reported crimes in Falls Church include larceny-theft, aggravated assault, and burglary. Property crime is generally more common than violent crime.
Is Falls Church safe to visit?
Like any city, Falls Church has areas that are safer than others. The city's overall safety score is 52/100 based on FBI crime data. Standard travel precautions are recommended.