 Violent
 Property
Total
Property
Total
Quick answer
According to crimebycity.com's analysis of FBI 2024 crime data, Ferndale, WA has a Safety Score of 49/100 — higher crime than 51% of US cities — with a total crime rate of 1,706.3 per 100,000 residents, ranking #1,510 of 2,971 US cities and #20 of 87 in Washington.
Safety Score
Violent Crime Rate
Property Crime Rate
Is Ferndale, Washington Safe?
Nestled on the Nooksack River, Ferndale, WA is a town of over 13,000 residents, known for its historic Pioneer Park. The town's early economy was driven by timber and agriculture.
Ferndale has a safety score of 49/100 (Higher Crime Than Average). Based on FBI data for 2024, the city reported a total crime rate of 1,706.3 per 100,000 residents, compared to the national average of 2,752.3 per 100,000.
Ferndale ranks #20 out of 87 cities in Washington and #1510 out of 2971 nationally (safest first). This places it in the 49th percentile for safety — with higher crime than 51% of US cities.
Year over year, Ferndale's total crime rate decreased by 9.9%, with violent crime declining 53%.
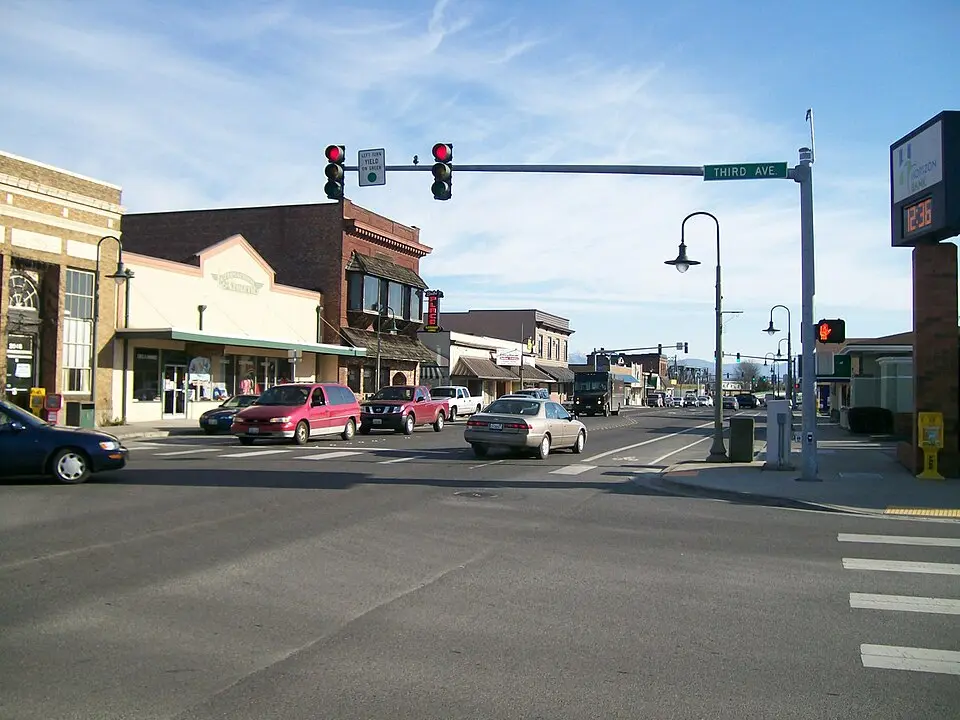
Photo: Wikimedia Commons
Ferndale Crime Statistics Breakdown (2024)
| Crime Type | Incidents | Rate per 100K | National Avg |
|---|---|---|---|
| Violent Crime | 17 | 104.3 | 473.3 |
| Murder | 0 | 0.0 | 6.2 |
| Rape | 4 | 24.6 | 43.4 |
| Robbery | 2 | 12.3 | 93.0 |
| Aggravated Assault | 11 | 67.5 | 330.0 |
| Property Crime | 261 | 1,601.9 | 2,279.1 |
| Burglary | 38 | 233.2 | 287.8 |
| Larceny-Theft | 211 | 1,295.0 | 1,638.9 |
| Motor Vehicle Theft | 12 | 73.7 | 352.4 |
| Arson | 0 | 0.0 | 0.0 |
Ferndale vs Washington Average
How does Ferndale's crime rate compare to the Washington state average?
| Metric | Ferndale | Washington Avg | Difference |
|---|---|---|---|
| Violent Crime Rate | 104.3 | 439.5 | -76.3% |
| Property Crime Rate | 1,601.9 | 3,428.6 | -53.3% |
| Murder Rate | 0.0 | 4.7 | -100.0% |
| Total Crime Rate | 1,706.3 | 3,868.1 | -55.9% |
Ferndale Crime Rate Trends
Year-over-year crime rate changes for Ferndale, Washington.
| Year | Coverage | Total Crime Rate | Violent Crime Rate | Property Crime Rate |
|---|---|---|---|---|
| 2024 | 16,293 | 1,706.3 | 104.3 | 1,601.9 |
| 2023 | 16,214 | 1,893.4 | 222.0 | 1,671.4 |
| 2022 | 15,816 | 2,971.7 | 177.0 | 2,794.6 |
| 2021 | 16,006 | 2,330.4 | 143.7 | 2,186.7 |
| 2020 | 15,337 | 2,595.0 | 104.3 | 2,490.7 |
| 2019 | 15,007 | 1,905.8 | 233.2 | 1,672.6 |
Frequently Asked Questions
Is Ferndale, Washington safe?
Ferndale has a safety score of 49/100, meaning it has less crime than about 49% of US cities in our FBI dataset. With a total crime rate of 1,706.3 per 100,000 residents in 2024, Ferndale is higher-crime than most US cities.
What is the crime rate in Ferndale, Washington?
According to FBI data for 2024, Ferndale has a violent crime rate of 104.3 per 100,000 and a property crime rate of 1,601.9 per 100,000 residents.
How does Ferndale compare to the national average?
Ferndale's total crime rate of 1,706.3 per 100,000 can be compared to the national average. The data covers 16,293 residents.
What types of crime are most common in Ferndale?
Based on FBI 2024 data, the most reported crimes in Ferndale include larceny-theft, aggravated assault, and burglary. Property crime is generally more common than violent crime.
Is Ferndale safe to visit?
Like any city, Ferndale has areas that are safer than others. The city's overall safety score is 49/100 based on FBI crime data. Standard travel precautions are recommended.