 Violent
 Property
Total
Property
Total
Quick answer
According to crimebycity.com's analysis of FBI 2024 crime data, Lynden, WA has a Safety Score of 63/100 — safer than 63% of US cities — with a total crime rate of 1,309.1 per 100,000 residents, ranking #1,109 of 2,971 US cities and #13 of 87 in Washington.
Safety Score
Violent Crime Rate
Property Crime Rate
Is Lynden, Washington Safe?
Lynden, Washington, a town with strong Dutch heritage, is nestled in Whatcom County, just south of the Canadian border. Its economy relies heavily on agriculture, particularly dairy farming and raspberry production, shaping its rural character.
Lynden has a safety score of 63/100 (Near National Average). Based on FBI data for 2024, the city reported a total crime rate of 1,309.1 per 100,000 residents, compared to the national average of 2,752.3 per 100,000.
Lynden ranks #13 out of 87 cities in Washington and #1109 out of 2971 nationally (safest first). This places it in the 63rd percentile for safety — safer than 63% of US cities.
Year over year, Lynden's total crime rate decreased by 18.2%, with violent crime declining 2.6%.
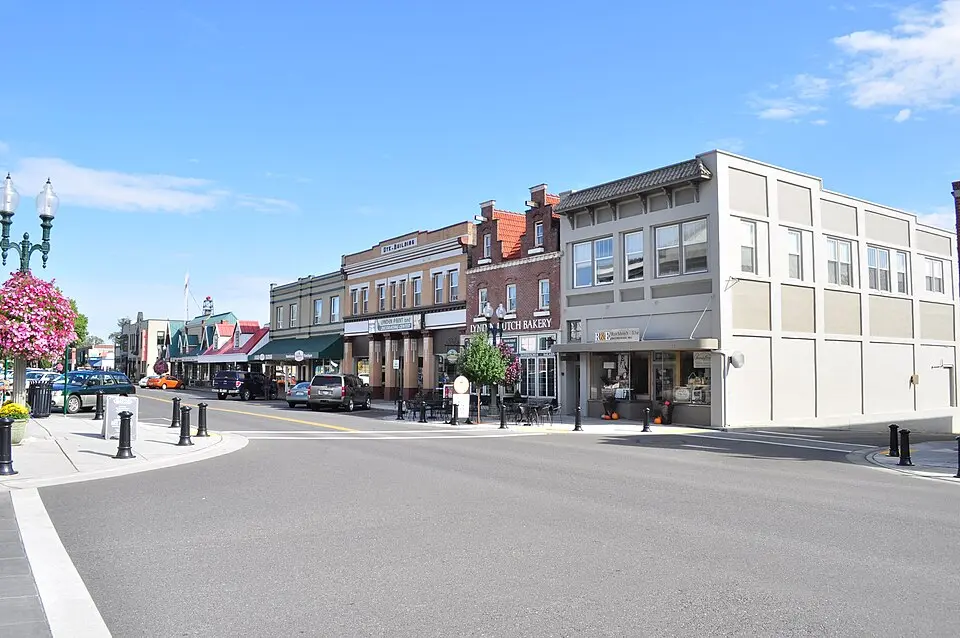
Photo: Wikimedia Commons
Lynden Crime Statistics Breakdown (2024)
| Crime Type | Incidents | Rate per 100K | National Avg |
|---|---|---|---|
| Violent Crime | 30 | 178.5 | 473.3 |
| Murder | 0 | 0.0 | 6.2 |
| Rape | 6 | 35.7 | 43.4 |
| Robbery | 3 | 17.9 | 93.0 |
| Aggravated Assault | 21 | 125.0 | 330.0 |
| Property Crime | 190 | 1,130.6 | 2,279.1 |
| Burglary | 18 | 107.1 | 287.8 |
| Larceny-Theft | 166 | 987.8 | 1,638.9 |
| Motor Vehicle Theft | 6 | 35.7 | 352.4 |
| Arson | 0 | 0.0 | 0.0 |
Lynden vs Washington Average
How does Lynden's crime rate compare to the Washington state average?
| Metric | Lynden | Washington Avg | Difference |
|---|---|---|---|
| Violent Crime Rate | 178.5 | 439.5 | -59.4% |
| Property Crime Rate | 1,130.6 | 3,428.6 | -67.0% |
| Murder Rate | 0.0 | 4.7 | -100.0% |
| Total Crime Rate | 1,309.1 | 3,868.1 | -66.2% |
Lynden Crime Rate Trends
Year-over-year crime rate changes for Lynden, Washington.
| Year | Coverage | Total Crime Rate | Violent Crime Rate | Property Crime Rate |
|---|---|---|---|---|
| 2024 | 16,805 | 1,309.1 | 178.5 | 1,130.6 |
| 2023 | 16,361 | 1,601.4 | 183.4 | 1,418.0 |
| 2022 | 16,275 | 2,224.3 | 116.7 | 2,107.5 |
| 2021 | 15,791 | 1,640.2 | 139.3 | 1,500.9 |
| 2020 | 15,625 | 1,683.2 | 134.4 | 1,548.8 |
| 2019 | 15,116 | 1,832.5 | 92.6 | 1,739.9 |
Frequently Asked Questions
Is Lynden, Washington safe?
Lynden has a safety score of 63/100, meaning it has less crime than about 63% of US cities in our FBI dataset. With a total crime rate of 1,309.1 per 100,000 residents in 2024, Lynden is about average for a US city.
What is the crime rate in Lynden, Washington?
According to FBI data for 2024, Lynden has a violent crime rate of 178.5 per 100,000 and a property crime rate of 1,130.6 per 100,000 residents.
How does Lynden compare to the national average?
Lynden's total crime rate of 1,309.1 per 100,000 can be compared to the national average. The data covers 16,805 residents.
What types of crime are most common in Lynden?
Based on FBI 2024 data, the most reported crimes in Lynden include larceny-theft, aggravated assault, and burglary. Property crime is generally more common than violent crime.
Is Lynden safe to visit?
Like any city, Lynden has areas that are safer than others. The city's overall safety score is 63/100 based on FBI crime data. Standard travel precautions are recommended.