 Violent
Property
Total
Violent
Property
Total
Quick answer
According to crimebycity.com's analysis of FBI 2024 crime data, Vancouver, WA has a Safety Score of 9/100 — higher crime than 91% of US cities — with a total crime rate of 3,991.0 per 100,000 residents, ranking #2,714 of 2,971 US cities and #70 of 87 in Washington.
Safety Score
Violent Crime Rate
Property Crime Rate
Is Vancouver, Washington Safe?
Vancouver, Washington, across the Columbia River from Portland, Oregon, is the fourth-largest city in Washington. It was the site of Fort Vancouver, a major 19th-century fur trading post. The city has seen significant growth, with a population over 190,000.
Vancouver has a safety score of 9/100 (High Crime). Based on FBI data for 2024, the city reported a total crime rate of 3,991.0 per 100,000 residents, compared to the national average of 2,752.3 per 100,000.
Vancouver ranks #70 out of 87 cities in Washington and #2714 out of 2971 nationally (safest first). This places it in the 9th percentile for safety — with higher crime than 91% of US cities.
The most elevated crime category in Vancouver is motor vehicle theft, at 596.9 per 100K — 1.7x the national average.
Year over year, Vancouver's total crime rate decreased by 22.4%, with violent crime declining 10.5%.
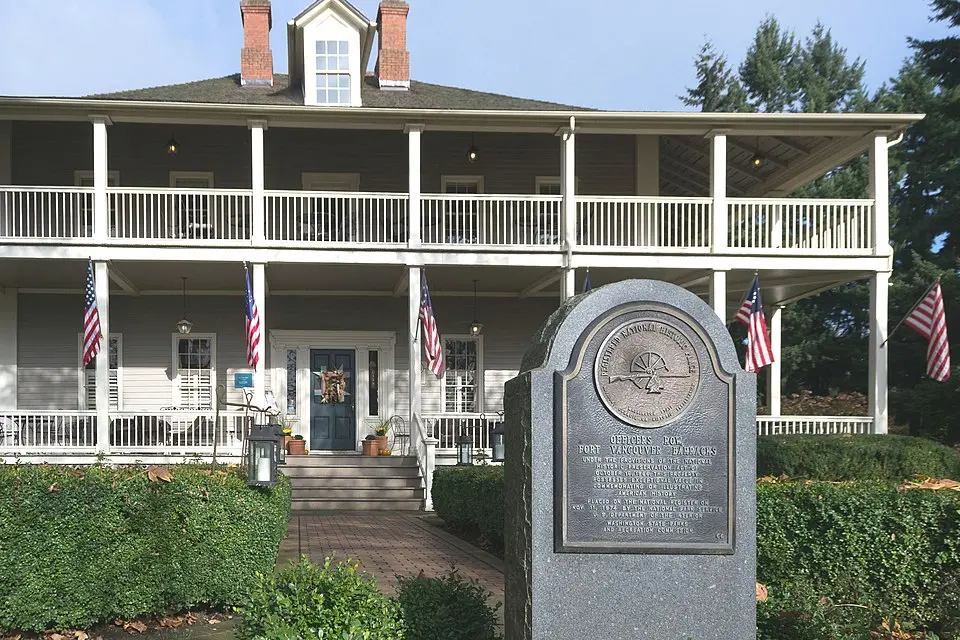
Photo: Wikimedia Commons
Vancouver Crime Statistics Breakdown (2024)
| Crime Type | Incidents | Rate per 100K | National Avg |
|---|---|---|---|
| Violent Crime | 1,157 | 583.8 | 473.3 |
| Murder | 11 | 5.6 | 6.2 |
| Rape | 122 | 61.6 | 43.4 |
| Robbery | 242 | 122.1 | 93.0 |
| Aggravated Assault | 779 | 393.1 | 330.0 |
| Property Crime | 6,753 | 3,407.3 | 2,279.1 |
| Burglary | 930 | 469.2 | 287.8 |
| Larceny-Theft | 4,640 | 2,341.1 | 1,638.9 |
| Motor Vehicle Theft | 1,183 | 596.9 | 352.4 |
| Arson | 0 | 0.0 | 0.0 |
Vancouver vs Washington Average
How does Vancouver's crime rate compare to the Washington state average?
| Metric | Vancouver | Washington Avg | Difference |
|---|---|---|---|
| Violent Crime Rate | 583.8 | 439.5 | +32.8% |
| Property Crime Rate | 3,407.3 | 3,428.6 | -0.6% |
| Murder Rate | 5.6 | 4.7 | +17.6% |
| Total Crime Rate | 3,991.0 | 3,868.1 | +3.2% |
Vancouver Crime Rate Trends
Year-over-year crime rate changes for Vancouver, Washington.
| Year | Coverage | Total Crime Rate | Violent Crime Rate | Property Crime Rate |
|---|---|---|---|---|
| 2024 | 198,194 | 3,991.0 | 583.8 | 3,407.3 |
| 2023 | 196,159 | 5,142.3 | 652.0 | 4,490.2 |
| 2022 | 193,273 | 6,383.7 | 657.6 | 5,726.1 |
| 2021 | 188,160 | 5,566.0 | 595.8 | 4,970.2 |
| 2020 | 186,440 | 4,310.8 | 491.3 | 3,819.5 |
| 2019 | 185,034 | 3,722.0 | 480.5 | 3,241.6 |
Frequently Asked Questions
Is Vancouver, Washington safe?
Vancouver has a safety score of 9/100, meaning it has less crime than about 9% of US cities in our FBI dataset. With a total crime rate of 3,991.0 per 100,000 residents in 2024, Vancouver is among the highest-crime US cities.
What is the crime rate in Vancouver, Washington?
According to FBI data for 2024, Vancouver has a violent crime rate of 583.8 per 100,000 and a property crime rate of 3,407.3 per 100,000 residents.
How does Vancouver compare to the national average?
Vancouver's total crime rate of 3,991.0 per 100,000 can be compared to the national average. The data covers 198,194 residents.
What types of crime are most common in Vancouver?
Based on FBI 2024 data, the most reported crimes in Vancouver include larceny-theft, aggravated assault, and burglary. Property crime is generally more common than violent crime.
Is Vancouver safe to visit?
Like any city, Vancouver has areas that are safer than others. The city's overall safety score is 9/100 based on FBI crime data. Standard travel precautions are recommended.