Is Bowling Green or Hawthorne Safer?
According to crimebycity.com's analysis of 2024 FBI data, Bowling Green is safer than Hawthorne (Safety Score 17/100 vs 16/100), with a total crime rate of 3,153 per 100,000 versus 3,193 for Hawthorne — 1% lower. Bowling Green has lower rates in 4 of 7 crime categories.
The biggest difference is in murder, where Bowling Green has a 87% lower rate.
Bowling Green — 5-Year Trend
 Violent
Property
Total
Violent
Property
Total
Hawthorne — 5-Year Trend
 Violent
 Property
Total
Property
Total
Bowling Green, KY
Hawthorne, CA
Detailed Crime Rate Comparison
| Crime Type | Bowling Green | Hawthorne | Difference |
|---|---|---|---|
| Total Crime Rate | 3,153.4 | 3,192.5 | -39.1 |
| Violent Crime Rate | 224.5 | 727.4 | -502.8 |
| Murder Rate | 1.3 | 9.8 | -8.5 |
| Rape Rate | 89.0 | 37.8 | +51.2 |
| Robbery Rate | 46.5 | 223.3 | -176.9 |
| Aggravated Assault Rate | 87.7 | 456.4 | -368.7 |
| Property Crime Rate | 2,928.9 | 2,465.2 | +463.7 |
| Burglary Rate | 340.6 | 291.7 | +49.0 |
| Larceny-Theft Rate | 2,322.5 | 1,385.1 | +937.4 |
| Motor Vehicle Theft Rate | 265.8 | 788.4 | -522.6 |
All rates per 100,000 residents. Source: FBI UCR 2024.
Frequently Asked Questions
Is Bowling Green or Hawthorne safer?
Bowling Green is safer with a total crime rate of 3,153 per 100K vs 3,193 for Hawthorne — a 1% difference.
How do violent crime rates compare?
Bowling Green has a violent crime rate of 224.5 per 100K while Hawthorne has 727.4. Bowling Green has lower violent crime.
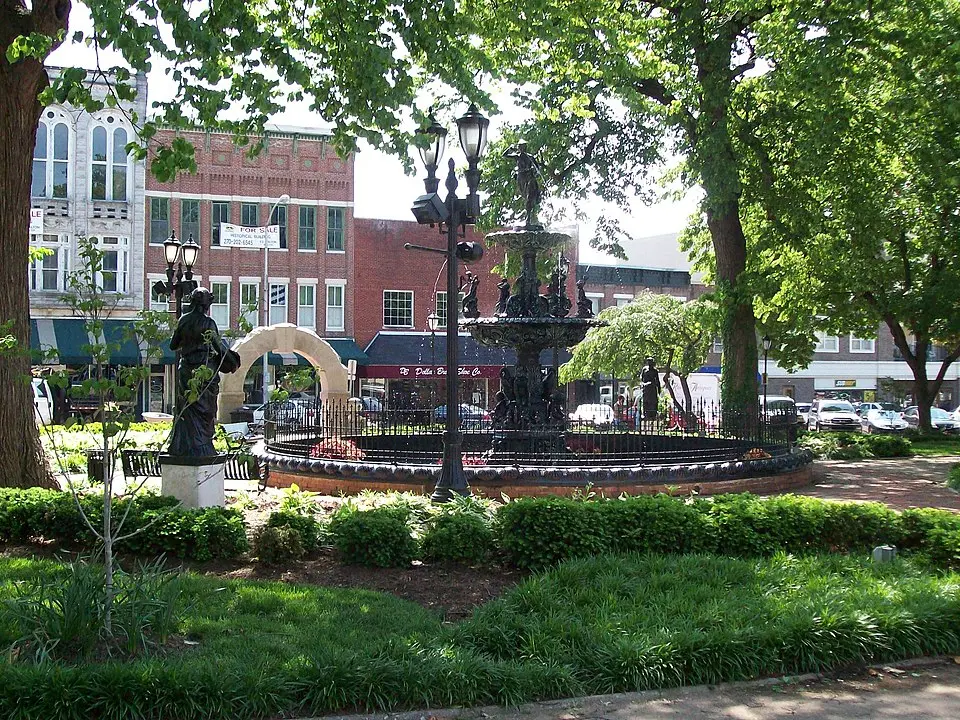
About Bowling Green, KY
Bowling Green, Kentucky, home to Western Kentucky University, sits on the Barren River. This city of over 70,000 residents is also home to the National Corvette Museum. With a safety score of 17/100 and a population coverage of 77,503, Bowling Green has a total crime rate of 3,153.4 per 100,000 residents.
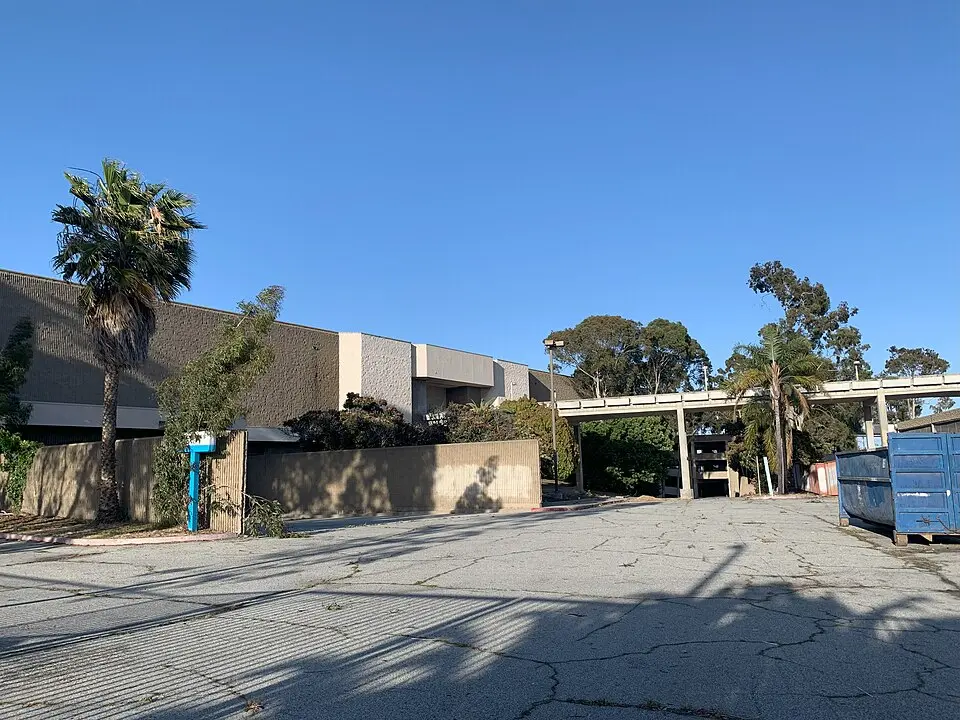
About Hawthorne, CA
Hawthorne, California, a city in the South Bay region of Los Angeles County, was once home to The Beach Boys. This diverse community, with a significant Hispanic population, spans approximately 6 square miles. With a safety score of 16/100 and a population coverage of 81,941, Hawthorne has a total crime rate of 3,192.5 per 100,000 residents.