Is Davenport or Hayward Safer?
According to crimebycity.com's analysis of 2024 FBI data, Davenport is safer than Hayward (Safety Score 8/100 vs 8/100), with a total crime rate of 4,123 per 100,000 versus 4,134 for Hayward — 0% lower. Davenport has higher rates in 3 of 7 crime categories.
The biggest difference is in robbery, where Davenport has a 63% lower rate.
Davenport — 5-Year Trend
 Violent
 Property
Total
Property
Total
Hayward — 5-Year Trend
 Violent
Property
Total
Violent
Property
Total
Davenport, IA
Hayward, CA
Detailed Crime Rate Comparison
| Crime Type | Davenport | Hayward | Difference |
|---|---|---|---|
| Total Crime Rate | 4,123.1 | 4,133.8 | -10.7 |
| Violent Crime Rate | 582.4 | 477.1 | +105.3 |
| Murder Rate | 8.0 | 7.8 | +0.2 |
| Rape Rate | 108.1 | 46.9 | +61.2 |
| Robbery Rate | 65.1 | 174.0 | -109.0 |
| Aggravated Assault Rate | 400.3 | 248.3 | +152.0 |
| Property Crime Rate | 3,540.6 | 3,656.7 | -116.0 |
| Burglary Rate | 653.5 | 364.4 | +289.1 |
| Larceny-Theft Rate | 2,555.9 | 1,915.7 | +640.2 |
| Motor Vehicle Theft Rate | 331.3 | 1,376.6 | -1,045.4 |
All rates per 100,000 residents. Source: FBI UCR 2024.
Frequently Asked Questions
Is Davenport or Hayward safer?
Davenport is safer with a total crime rate of 4,123 per 100K vs 4,134 for Hayward — a 0% difference.
How do violent crime rates compare?
Davenport has a violent crime rate of 582.4 per 100K while Hayward has 477.1. Hayward has lower violent crime.
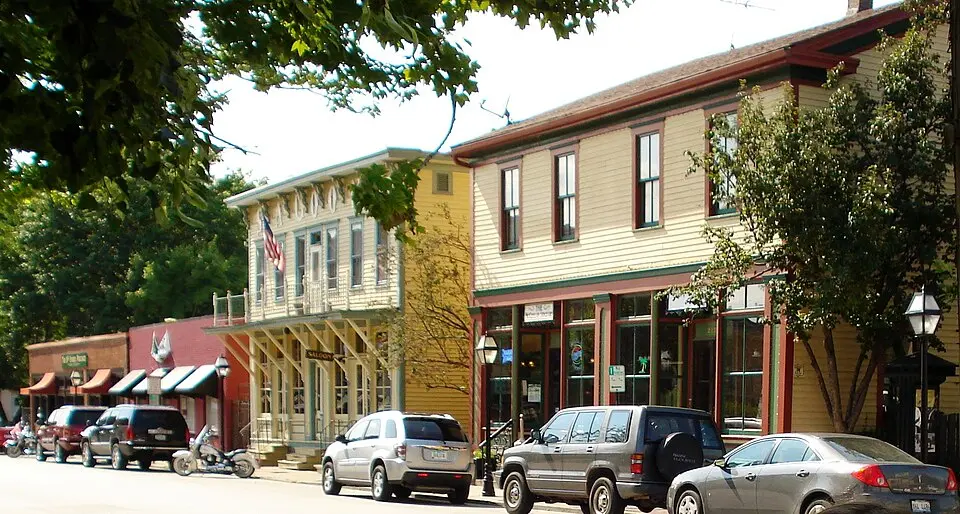
About Davenport, IA
Davenport, Iowa, one of the Quad Cities, sits on the Mississippi River's west bank. It's home to Palmer College of Chiropractic, the first chiropractic school. The city's population is diverse, with a notable Hispanic community. With a safety score of 8/100 and a population coverage of 99,926, Davenport has a total crime rate of 4,123.1 per 100,000 residents.
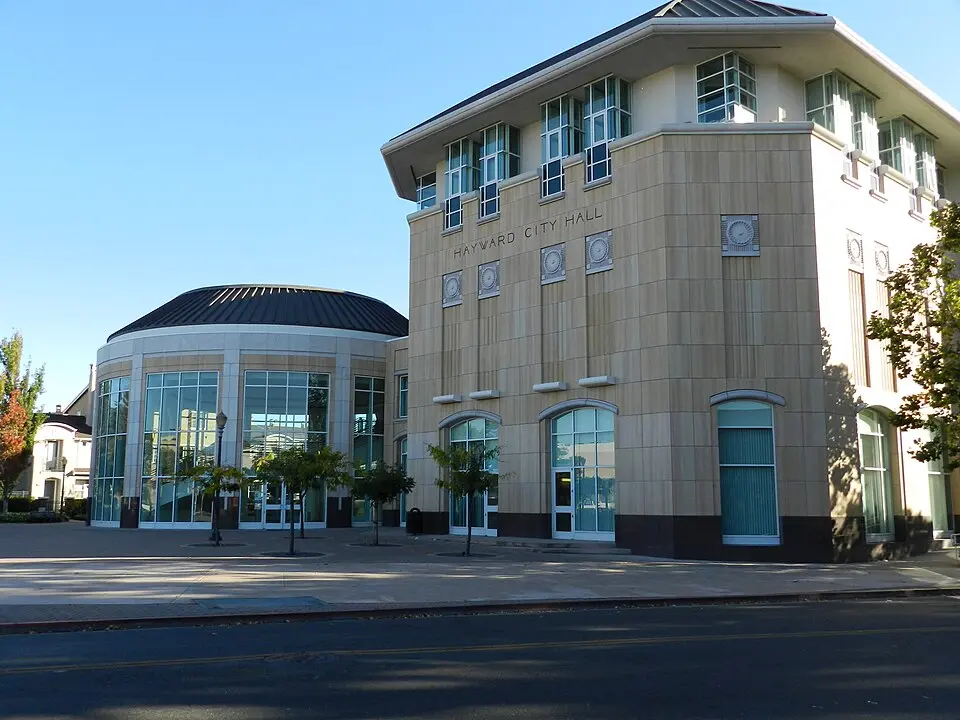
About Hayward, CA
Hayward, a diverse city in Alameda County, sits on the eastern shore of San Francisco Bay. Home to California State University, East Bay, it was once a major agricultural producer, especially known for its cherries and tomatoes. Its population is over 160,000 residents. With a safety score of 8/100 and a population coverage of 153,419, Hayward has a total crime rate of 4,133.8 per 100,000 residents.