Is Edmonds or Owensboro Safer?
According to crimebycity.com's analysis of 2024 FBI data, Edmonds is safer than Owensboro (Safety Score 15/100 vs 15/100), with a total crime rate of 3,261 per 100,000 versus 3,266 for Owensboro — 0% lower. Edmonds has higher rates in 2 of 7 crime categories.
The biggest difference is in murder, where Owensboro has a 29% lower rate.
Edmonds — 5-Year Trend
 Violent
Property
Total
Violent
Property
Total
Owensboro — 5-Year Trend
Violent
 Property
Total
Property
Total
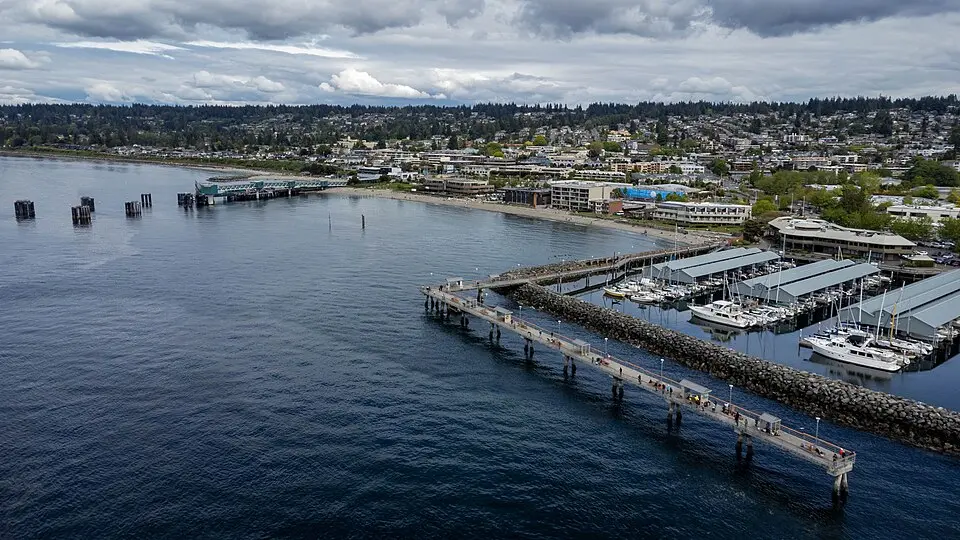
Edmonds, WA
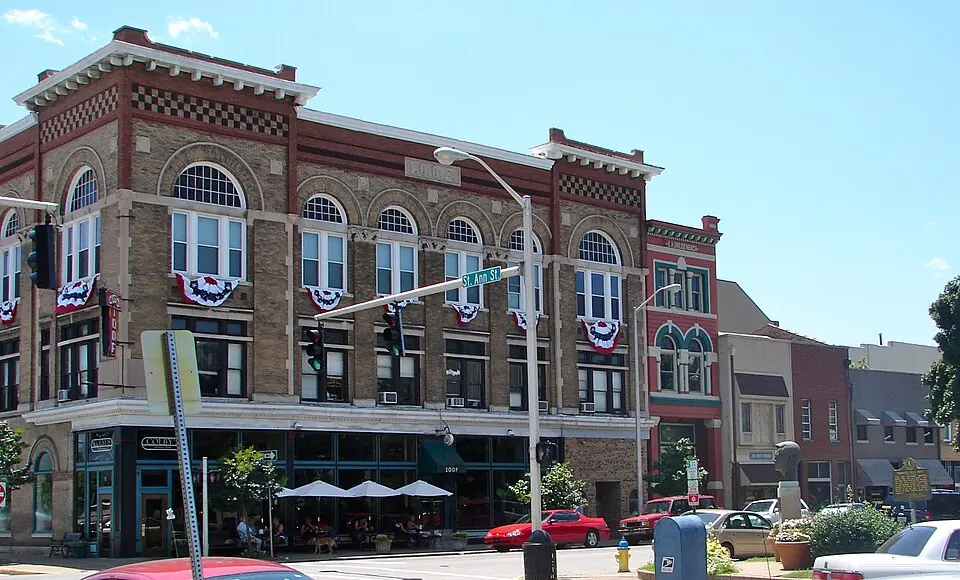
Owensboro, KY
Detailed Crime Rate Comparison
| Crime Type | Edmonds | Owensboro | Difference |
|---|---|---|---|
| Total Crime Rate | 3,260.7 | 3,266.4 | -5.7 |
| Violent Crime Rate | 260.2 | 349.4 | -89.2 |
| Murder Rate | 2.3 | 1.7 | +0.7 |
| Rape Rate | 37.5 | 78.2 | -40.7 |
| Robbery Rate | 51.6 | 44.9 | +6.6 |
| Aggravated Assault Rate | 168.8 | 224.6 | -55.9 |
| Property Crime Rate | 3,000.5 | 2,917.0 | +83.5 |
| Burglary Rate | 412.6 | 337.8 | +74.8 |
| Larceny-Theft Rate | 2,435.6 | 2,258.1 | +177.5 |
| Motor Vehicle Theft Rate | 152.4 | 321.2 | -168.8 |
All rates per 100,000 residents. Source: FBI UCR 2024.
Frequently Asked Questions
Is Edmonds or Owensboro safer?
Edmonds is safer with a total crime rate of 3,261 per 100K vs 3,266 for Owensboro — a 0% difference.
How do violent crime rates compare?
Edmonds has a violent crime rate of 260.2 per 100K while Owensboro has 349.4. Edmonds has lower violent crime.
About Edmonds, WA
Edmonds, a Puget Sound ferry terminal city, boasts views of the Olympic Mountains and was the first city in Washington with an underwater park. Its population is approximately 42,000, with a median age of 47. With a safety score of 15/100 and a population coverage of 42,659, Edmonds has a total crime rate of 3,260.7 per 100,000 residents.
About Owensboro, KY
Owensboro, Kentucky, known for its International Bluegrass Music Museum, sits on the Ohio River. This Daviess County seat is the fourth-largest city by population in the state. With a safety score of 15/100 and a population coverage of 60,096, Owensboro has a total crime rate of 3,266.4 per 100,000 residents.