Is Lynnwood or Myrtle Beach Safer?
According to crimebycity.com's analysis of 2024 FBI data, Lynnwood is safer than Myrtle Beach (Safety Score 1/100 vs 1/100), with a total crime rate of 6,331 per 100,000 versus 6,767 for Myrtle Beach — 6% lower. Lynnwood has higher rates in 3 of 7 crime categories.
The biggest difference is in violent crime, where Lynnwood has a 76% lower rate.
Lynnwood — 5-Year Trend
 Violent
 Property
Total
Property
Total
Myrtle Beach — 5-Year Trend
Violent
Property
Total
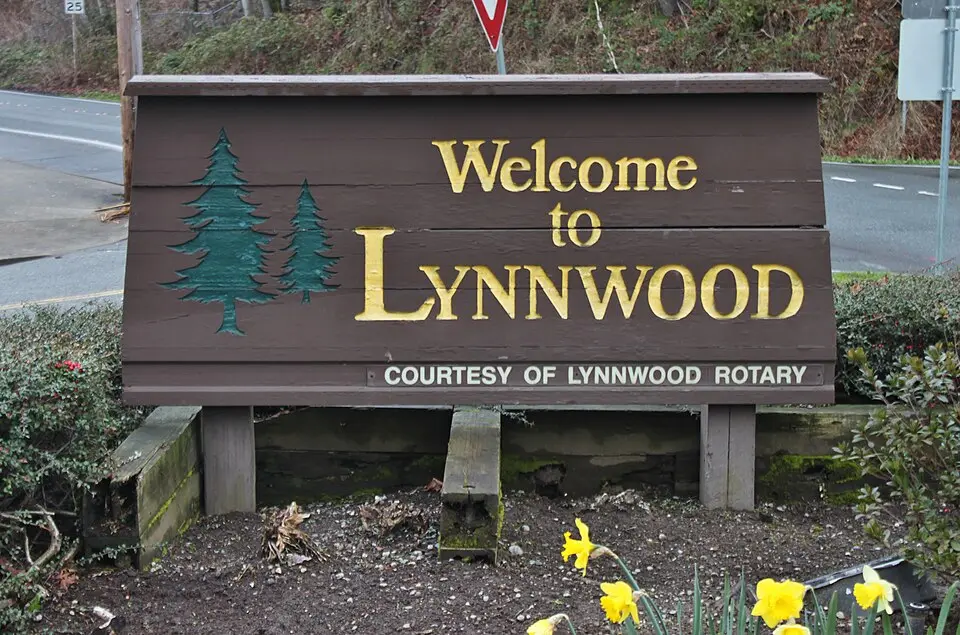
Lynnwood, WA
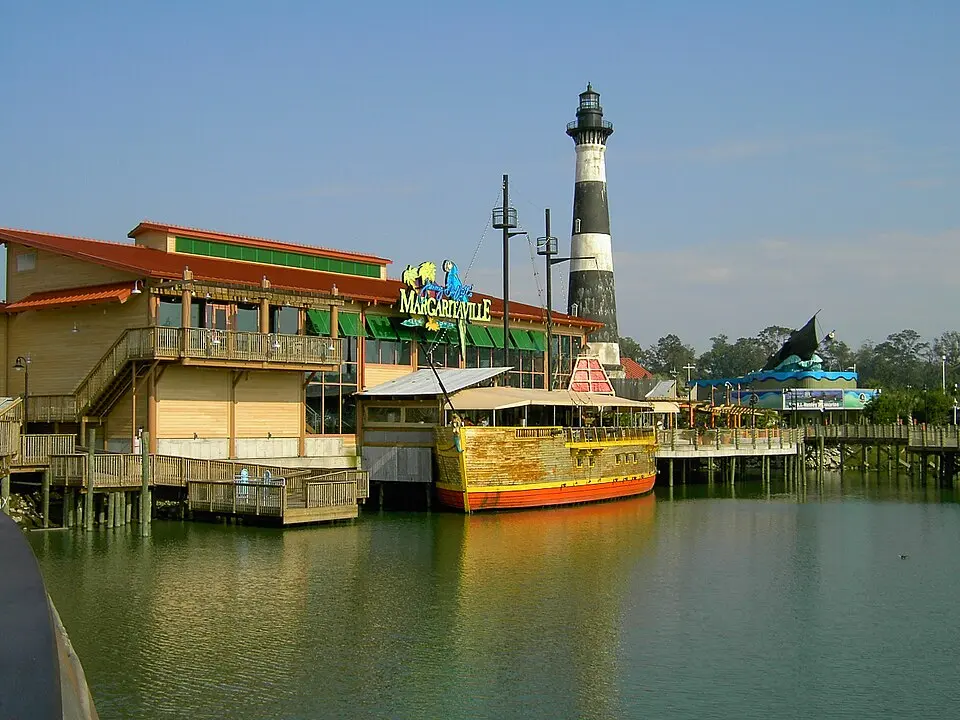
Myrtle Beach, SC
Detailed Crime Rate Comparison
| Crime Type | Lynnwood | Myrtle Beach | Difference |
|---|---|---|---|
| Total Crime Rate | 6,330.9 | 6,767.1 | -436.2 |
| Violent Crime Rate | 266.3 | 1,111.6 | -845.3 |
| Murder Rate | 8.7 | 12.2 | -3.5 |
| Rape Rate | 26.2 | 185.3 | -159.1 |
| Robbery Rate | 107.0 | 173.1 | -66.1 |
| Aggravated Assault Rate | 122.3 | 741.1 | -618.8 |
| Property Crime Rate | 6,064.6 | 5,655.5 | +409.1 |
| Burglary Rate | 504.3 | 446.1 | +58.2 |
| Larceny-Theft Rate | 4,986.1 | 4,814.5 | +171.7 |
| Motor Vehicle Theft Rate | 574.2 | 394.9 | +179.2 |
All rates per 100,000 residents. Source: FBI UCR 2024.
Frequently Asked Questions
Is Lynnwood or Myrtle Beach safer?
Lynnwood is safer with a total crime rate of 6,331 per 100K vs 6,767 for Myrtle Beach — a 6% difference.
How do violent crime rates compare?
Lynnwood has a violent crime rate of 266.3 per 100K while Myrtle Beach has 1,111.6. Lynnwood has lower violent crime.
About Lynnwood, WA
Lynnwood, a suburban city north of Seattle, was incorporated in 1959. Its strategic location at the junction of I-5 and I-405 contributes to its diverse population and commercial growth, with a significant Asian population. With a safety score of 1/100 and a population coverage of 45,807, Lynnwood has a total crime rate of 6,330.9 per 100,000 residents.
About Myrtle Beach, SC
Myrtle Beach, a popular East Coast vacation destination, is known for its "Grand Strand" of beaches and numerous golf courses. This coastal city in Horry County experiences a significant influx of tourists, especially during the summer months. With a safety score of 1/100 and a population coverage of 41,022, Myrtle Beach has a total crime rate of 6,767.1 per 100,000 residents.