Is Marysville or Richmond Safer?
According to crimebycity.com's analysis of 2024 FBI data, Marysville is safer than Richmond (Safety Score 35/100 vs 35/100), with a total crime rate of 2,187 per 100,000 versus 2,188 for Richmond — 0% lower. Marysville has lower rates in 4 of 7 crime categories.
The biggest difference is in murder, where Marysville has a 100% lower rate.
Marysville — 5-Year Trend
 Violent
 Property
Total
Property
Total
Richmond — 5-Year Trend
Violent
 Property
Total
Property
Total
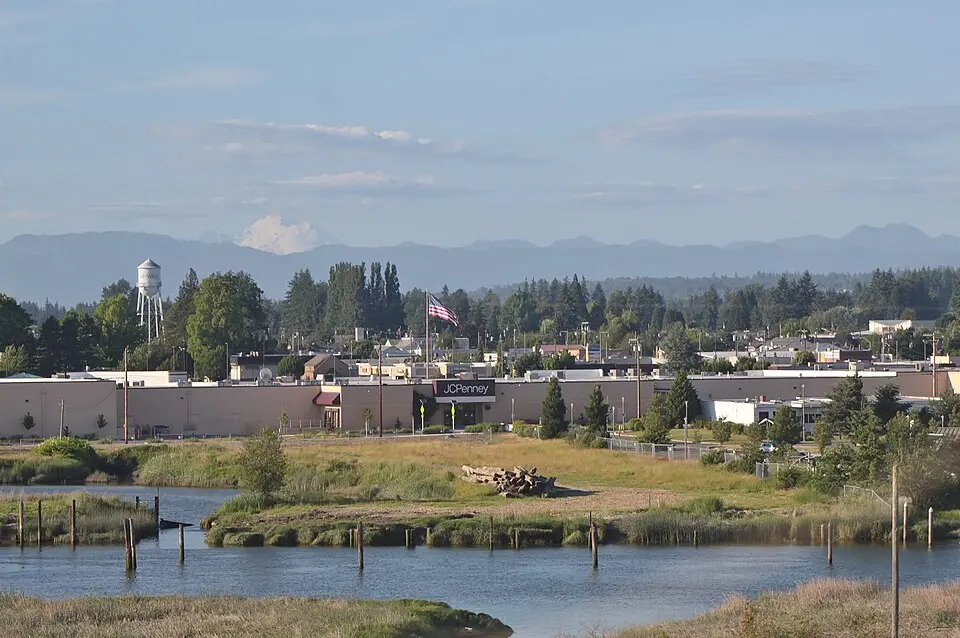
Marysville, WA
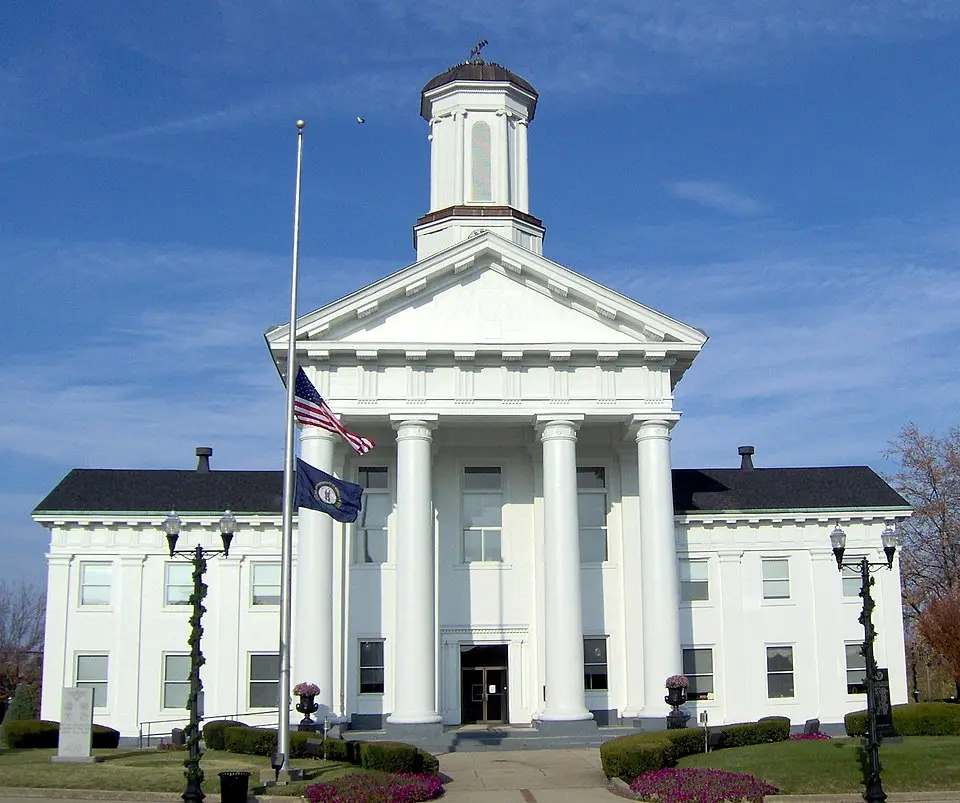
Richmond, KY
Detailed Crime Rate Comparison
| Crime Type | Marysville | Richmond | Difference |
|---|---|---|---|
| Total Crime Rate | 2,186.9 | 2,188.0 | -1.0 |
| Violent Crime Rate | 233.8 | 215.4 | +18.4 |
| Murder Rate | 0.0 | 5.3 | -5.3 |
| Rape Rate | 59.8 | 57.8 | +2.0 |
| Robbery Rate | 48.9 | 47.3 | +1.7 |
| Aggravated Assault Rate | 125.1 | 105.1 | +20.0 |
| Property Crime Rate | 1,953.2 | 1,972.6 | -19.4 |
| Burglary Rate | 221.6 | 328.3 | -106.8 |
| Larceny-Theft Rate | 1,454.3 | 1,457.8 | -3.4 |
| Motor Vehicle Theft Rate | 277.3 | 186.5 | +90.8 |
All rates per 100,000 residents. Source: FBI UCR 2024.
Frequently Asked Questions
Is Marysville or Richmond safer?
Marysville is safer with a total crime rate of 2,187 per 100K vs 2,188 for Richmond — a 0% difference.
How do violent crime rates compare?
Marysville has a violent crime rate of 233.8 per 100K while Richmond has 215.4. Richmond has lower violent crime.
About Marysville, WA
Marysville, originally a trading post, sits on the Snohomish River delta, serving as a bedroom community north of Everett. Its population is largely working-class families, drawn to the area's more affordable housing. With a safety score of 35/100 and a population coverage of 73,573, Marysville has a total crime rate of 2,186.9 per 100,000 residents.
About Richmond, KY
Richmond, Kentucky, home to Eastern Kentucky University, is a city in Madison County, located in the Bluegrass region. Its population was over 36,000 in 2020. With a safety score of 35/100 and a population coverage of 38,072, Richmond has a total crime rate of 2,188.0 per 100,000 residents.