Moving from Mount Pleasant, SC to Rock Hill, SC?
The Moving Checklist Planner turns your move-in date into a dated checklist, packing inventory and budget — seven tabs for Google Sheets or Excel, $12 once.
Is Mount Pleasant, SC or Rock Hill, SC Safer?
According to crimebycity.com's analysis of FBI data, Mount Pleasant, SC is safer than Rock Hill, SC (Safety Score 63/100 vs 23/100), with a total crime rate of 1,300 per 100,000 versus 2,790 for Rock Hill, SC — 53% lower. Mount Pleasant has lower rates in 7 of 7 crime categories.
The biggest difference is in murder, where Mount Pleasant has a 100% lower rate.
Quiz: which of these is MORE DANGEROUS than Mount Pleasant, SC?
Mount Pleasant — 5-Year Trend
 Violent
 Property
Total
Rock Hill — 5-Year Trend
 Violent
Property
Total
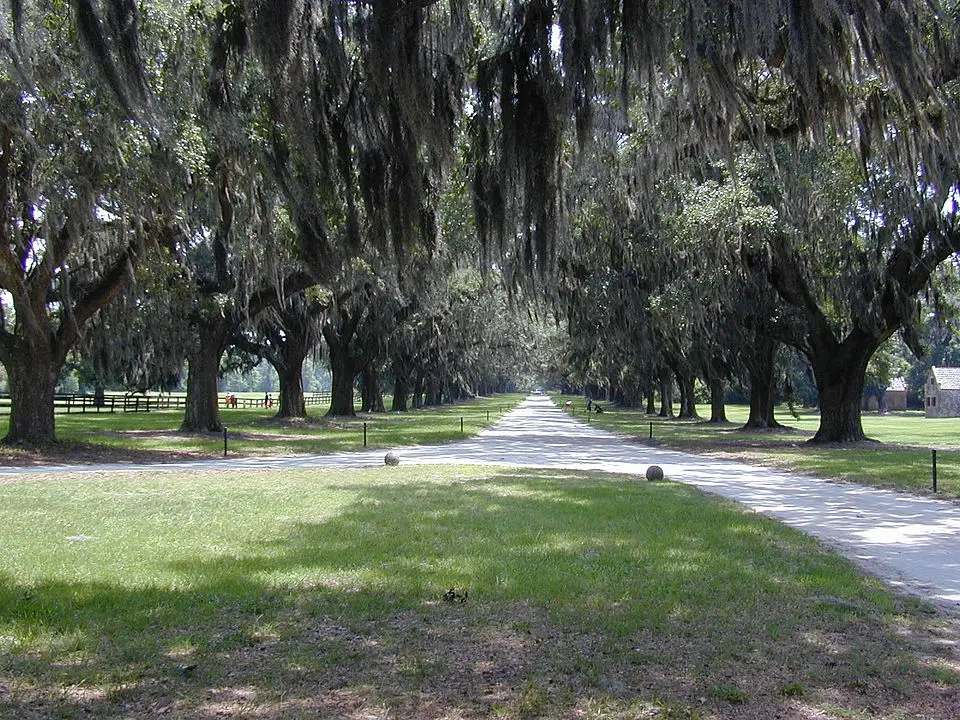
Mount Pleasant, SC
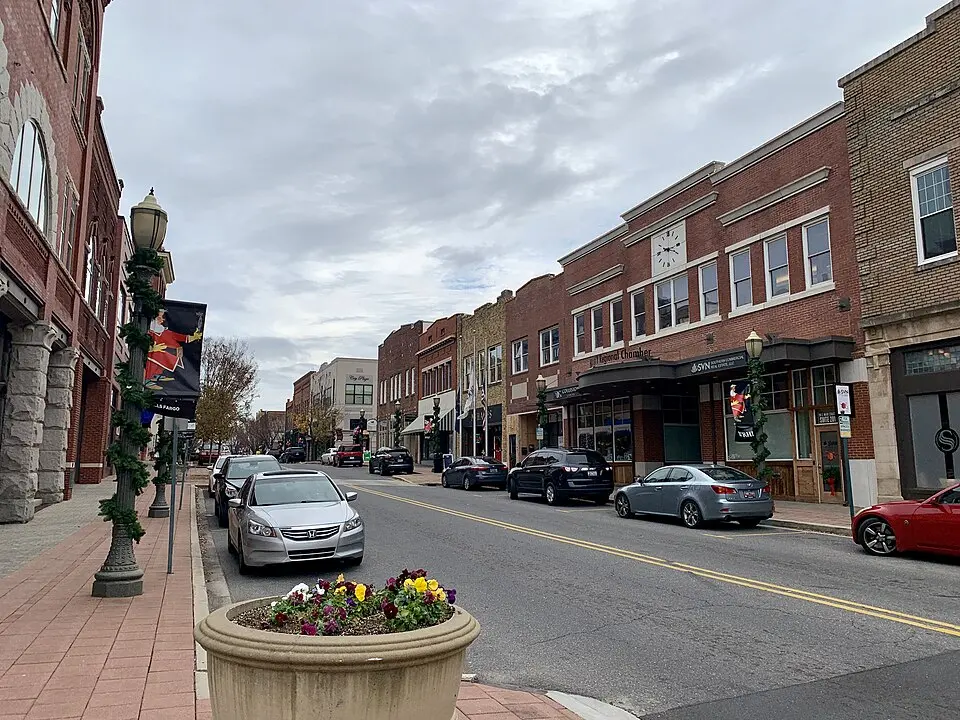
Rock Hill, SC
Detailed Crime Rate Comparison
| Crime Type | Mount Pleasant | Rock Hill | Difference |
|---|---|---|---|
| Total Crime Rate | 1,300.1 | 2,790.4 | -1,490.3 |
| Violent Crime Rate | 128.4 | 442.3 | -313.9 |
| Murder Rate | 0.0 | 11.9 | -11.9 |
| Rape Rate | 14.5 | 34.2 | -19.7 |
| Robbery Rate | 21.7 | 39.5 | -17.8 |
| Aggravated Assault Rate | 92.1 | 355.4 | -263.3 |
| Property Crime Rate | 1,171.8 | 2,348.1 | -1,176.4 |
| Burglary Rate | 98.3 | 275.1 | -176.8 |
| Larceny-Theft Rate | 999.9 | 1,807.2 | -807.3 |
| Motor Vehicle Theft Rate | 73.5 | 265.9 | -192.4 |
All rates per 100,000 residents. Source: FBI UCR.
Moving from Mount Pleasant, SC to Rock Hill, SC?
The Moving Checklist Planner turns your move-in date into a dated checklist, packing inventory and budget — seven tabs for Google Sheets or Excel, $12 once.
Frequently Asked Questions
Is Mount Pleasant or Rock Hill safer?
Mount Pleasant, SC is safer with a total crime rate of 1,300 per 100K vs 2,790 for Rock Hill, SC — a 53% difference.
How do violent crime rates compare?
Mount Pleasant has a violent crime rate of 128.4 per 100K while Rock Hill has 442.3. Mount Pleasant has lower violent crime.
About Mount Pleasant, SC
Mount Pleasant, SC, a large suburban town across the Cooper River from Charleston, was originally home to the Sewee people. Today, it's one of South Carolina's fastest-growing municipalities, with a median age of around 40. With a safety score of 63/100 and a population coverage of 96,608, Mount Pleasant has a total crime rate of 1,300.1 per 100,000 residents.
About Rock Hill, SC
Rock Hill, South Carolina, a city in York County, is known for its textile heritage and as the site of the first sit-ins of the modern Civil Rights Movement. Situated just south of Charlotte, North Carolina, it boasts a population reflecting a diverse mix of long-time residents and newcomers. With a safety score of 23/100 and a population coverage of 75,975, Rock Hill has a total crime rate of 2,790.4 per 100,000 residents.