Moving from San Francisco, CA to San Marino, CA?
The Moving Checklist Planner turns your move-in date into a dated checklist, packing inventory and budget — seven tabs for Google Sheets or Excel, $12 once.
Is San Francisco or San Marino Safer?
According to crimebycity.com's analysis of FBI data, San Marino is safer than San Francisco (Safety Score 66/100 vs 6/100), with a total crime rate of 1,210 per 100,000 versus 4,526 for San Francisco — 73% lower. San Francisco has higher rates in 0 of 7 crime categories.
The biggest difference is in murder, where San Marino has a 100% lower rate.
Note: San Francisco is 67.9x larger by coverage, which can affect crime rate comparisons. Larger cities tend to report higher rates due to density and more comprehensive reporting.
Quiz: which of these is SAFER than San Francisco, CA?
San Francisco — 5-Year Trend
 Violent
Property
Total
San Marino — 5-Year Trend
Violent
Property
Total
San Francisco, CA
San Marino, CA

Detailed Crime Rate Comparison
| Crime Type | San Francisco | San Marino | Difference |
|---|---|---|---|
| Total Crime Rate | 4,525.6 | 1,210.2 | +3,315.4 |
| Violent Crime Rate | 596.5 | 33.9 | +562.7 |
| Murder Rate | 4.4 | 0.0 | +4.4 |
| Rape Rate | 34.9 | 0.0 | +34.9 |
| Robbery Rate | 267.2 | 0.0 | +267.2 |
| Aggravated Assault Rate | 290.1 | 33.9 | +256.2 |
| Property Crime Rate | 3,929.1 | 1,176.4 | +2,752.7 |
| Burglary Rate | 637.5 | 465.5 | +172.0 |
| Larceny-Theft Rate | 2,618.9 | 643.2 | +1,975.7 |
| Motor Vehicle Theft Rate | 672.7 | 67.7 | +605.0 |
All rates per 100,000 residents. Source: FBI UCR.
Moving from San Francisco, CA to San Marino, CA?
The Moving Checklist Planner turns your move-in date into a dated checklist, packing inventory and budget — seven tabs for Google Sheets or Excel, $12 once.
Frequently Asked Questions
Is San Francisco or San Marino safer?
San Marino is safer with a total crime rate of 1,210 per 100K vs 4,526 for San Francisco — a 73% difference.
How do violent crime rates compare?
San Francisco has a violent crime rate of 596.5 per 100K while San Marino has 33.9. San Marino has lower violent crime.
About San Francisco, CA
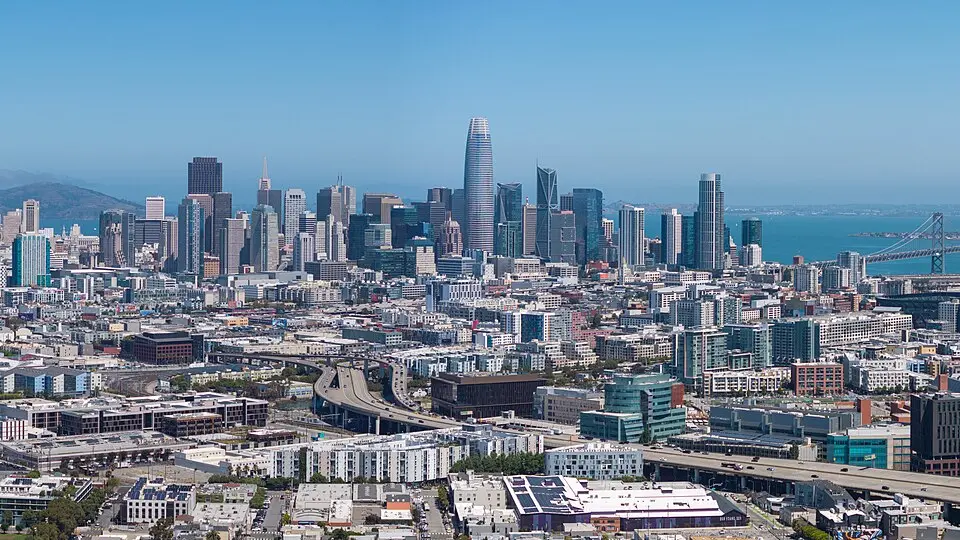
San Francisco, a vibrant Northern California port city renowned for its iconic Golden Gate Bridge, spans a hilly peninsula. Home to a diverse population of nearly 850,000, it was a pivotal center of the counterculture movement in the 1960s. With a safety score of 6/100 and a population coverage of 802,856, San Francisco has a total crime rate of 4,525.6 per 100,000 residents.
About San Marino, CA
Nestled in the San Gabriel Valley, San Marino is a small, affluent city known for the Huntington Library, Art Museum, and Botanical Gardens. Its tree-lined streets and spacious homes house a population with a significant Asian American presence. With a safety score of 66/100 and a population coverage of 11,816, San Marino has a total crime rate of 1,210.2 per 100,000 residents.