 Violent
 Property
Total
Property
Total
Quick answer
According to crimebycity.com's analysis of FBI 2024 crime data, Huntington Beach, CA has a Safety Score of 35/100 — higher crime than 65% of US cities — with a total crime rate of 2,196.4 per 100,000 residents, ranking #1,927 of 2,971 US cities and #147 of 264 in California.
Safety Score
Violent Crime Rate
Property Crime Rate
Is Huntington Beach, California Safe?
Huntington Beach, "Surf City, USA," stretches along the Pacific, a vibrant Orange County city with a significant tourist draw. Its lengthy pier and consistent waves attract a youthful, active population.
Huntington Beach has a safety score of 35/100 (Higher Crime Than Average). Based on FBI data for 2024, the city reported a total crime rate of 2,196.4 per 100,000 residents, compared to the national average of 2,752.3 per 100,000.
Huntington Beach ranks #147 out of 264 cities in California and #1927 out of 2971 nationally (safest first). This places it in the 35th percentile for safety — with higher crime than 65% of US cities.
Year over year, Huntington Beach's total crime rate decreased by 2.3%, with violent crime declining 4.2%.
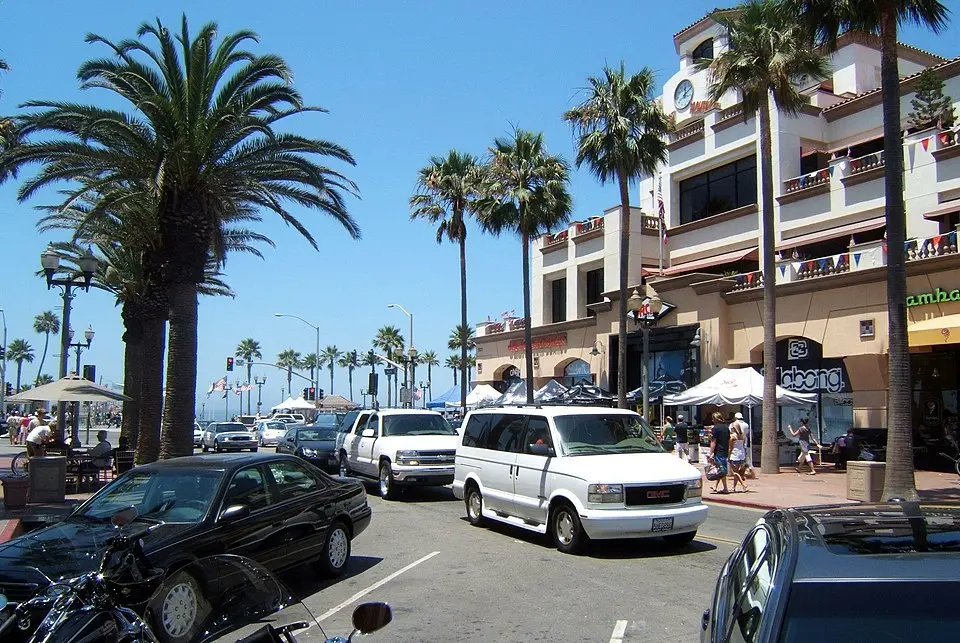
Photo: Wikimedia Commons
Huntington Beach Crime Statistics Breakdown (2024)
| Crime Type | Incidents | Rate per 100K | National Avg |
|---|---|---|---|
| Violent Crime | 394 | 207.3 | 473.3 |
| Murder | 5 | 2.6 | 6.2 |
| Rape | 66 | 34.7 | 43.4 |
| Robbery | 97 | 51.0 | 93.0 |
| Aggravated Assault | 226 | 118.9 | 330.0 |
| Property Crime | 3,781 | 1,989.2 | 2,279.1 |
| Burglary | 382 | 201.0 | 287.8 |
| Larceny-Theft | 3,125 | 1,644.0 | 1,638.9 |
| Motor Vehicle Theft | 274 | 144.2 | 352.4 |
| Arson | 0 | 0.0 | 0.0 |
Huntington Beach vs California Average
How does Huntington Beach's crime rate compare to the California state average?
| Metric | Huntington Beach | California Avg | Difference |
|---|---|---|---|
| Violent Crime Rate | 207.3 | 518.0 | -60.0% |
| Property Crime Rate | 1,989.2 | 2,161.3 | -8.0% |
| Murder Rate | 2.6 | 4.4 | -40.2% |
| Total Crime Rate | 2,196.4 | 2,679.3 | -18.0% |
Huntington Beach Crime Rate Trends
Year-over-year crime rate changes for Huntington Beach, California.
| Year | Coverage | Total Crime Rate | Violent Crime Rate | Property Crime Rate |
|---|---|---|---|---|
| 2024 | 190,081 | 2,196.4 | 207.3 | 1,989.2 |
| 2023 | 192,292 | 2,249.2 | 216.3 | 2,032.9 |
| 2022 | 194,618 | 2,496.2 | 253.8 | 2,242.3 |
| 2020 | 200,128 | 2,209.1 | 246.3 | 1,962.7 |
| 2019 | 201,843 | 2,244.3 | 191.2 | 2,053.1 |
Frequently Asked Questions
Is Huntington Beach, California safe?
Huntington Beach has a safety score of 35/100, meaning it has less crime than about 35% of US cities in our FBI dataset. With a total crime rate of 2,196.4 per 100,000 residents in 2024, Huntington Beach is higher-crime than most US cities.
What is the crime rate in Huntington Beach, California?
According to FBI data for 2024, Huntington Beach has a violent crime rate of 207.3 per 100,000 and a property crime rate of 1,989.2 per 100,000 residents.
How does Huntington Beach compare to the national average?
Huntington Beach's total crime rate of 2,196.4 per 100,000 can be compared to the national average. The data covers 190,081 residents.
What types of crime are most common in Huntington Beach?
Based on FBI 2024 data, the most reported crimes in Huntington Beach include larceny-theft, aggravated assault, and burglary. Property crime is generally more common than violent crime.
Is Huntington Beach safe to visit?
Like any city, Huntington Beach has areas that are safer than others. The city's overall safety score is 35/100 based on FBI crime data. Standard travel precautions are recommended.