Is Garland or Huntington Beach Safer?
According to crimebycity.com's analysis of 2024 FBI data, Huntington Beach is safer than Garland (Safety Score 35/100 vs 35/100), with a total crime rate of 2,196 per 100,000 versus 2,222 for Garland — 1% lower. Garland has higher rates in 2 of 7 crime categories.
The biggest difference is in murder, where Huntington Beach has a 46% lower rate.
Garland — 5-Year Trend
 Violent
Property
Total
Violent
Property
Total
Huntington Beach — 5-Year Trend
 Violent
 Property
Total
Property
Total
Garland, TX
Huntington Beach, CA
Detailed Crime Rate Comparison
| Crime Type | Garland | Huntington Beach | Difference |
|---|---|---|---|
| Total Crime Rate | 2,221.7 | 2,196.4 | +25.3 |
| Violent Crime Rate | 233.5 | 207.3 | +26.2 |
| Murder Rate | 4.9 | 2.6 | +2.2 |
| Rape Rate | 26.4 | 34.7 | -8.3 |
| Robbery Rate | 60.5 | 51.0 | +9.5 |
| Aggravated Assault Rate | 140.9 | 118.9 | +22.0 |
| Property Crime Rate | 1,988.2 | 1,989.2 | -1.0 |
| Burglary Rate | 303.3 | 201.0 | +102.4 |
| Larceny-Theft Rate | 1,283.6 | 1,644.0 | -360.4 |
| Motor Vehicle Theft Rate | 401.2 | 144.2 | +257.1 |
All rates per 100,000 residents. Source: FBI UCR 2024.
Frequently Asked Questions
Is Garland or Huntington Beach safer?
Huntington Beach is safer with a total crime rate of 2,196 per 100K vs 2,222 for Garland — a 1% difference.
How do violent crime rates compare?
Garland has a violent crime rate of 233.5 per 100K while Huntington Beach has 207.3. Huntington Beach has lower violent crime.
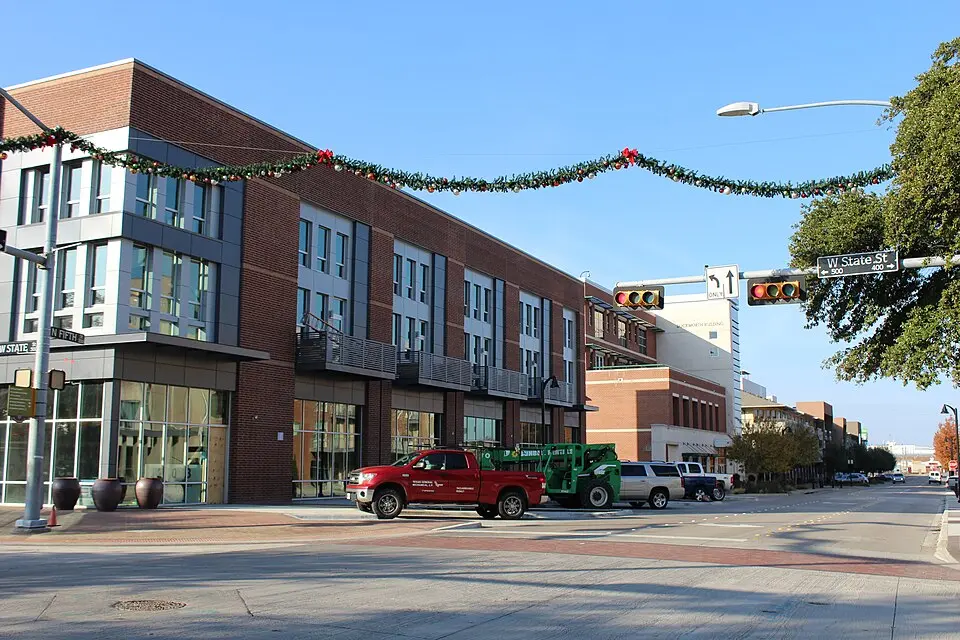
About Garland, TX
Garland, a large suburb northeast of Dallas, was once known as the "Watermelon Capital of the World." Its diverse population of over 240,000 makes it the 12th most populous city in Texas. With a safety score of 35/100 and a population coverage of 246,255, Garland has a total crime rate of 2,221.7 per 100,000 residents.
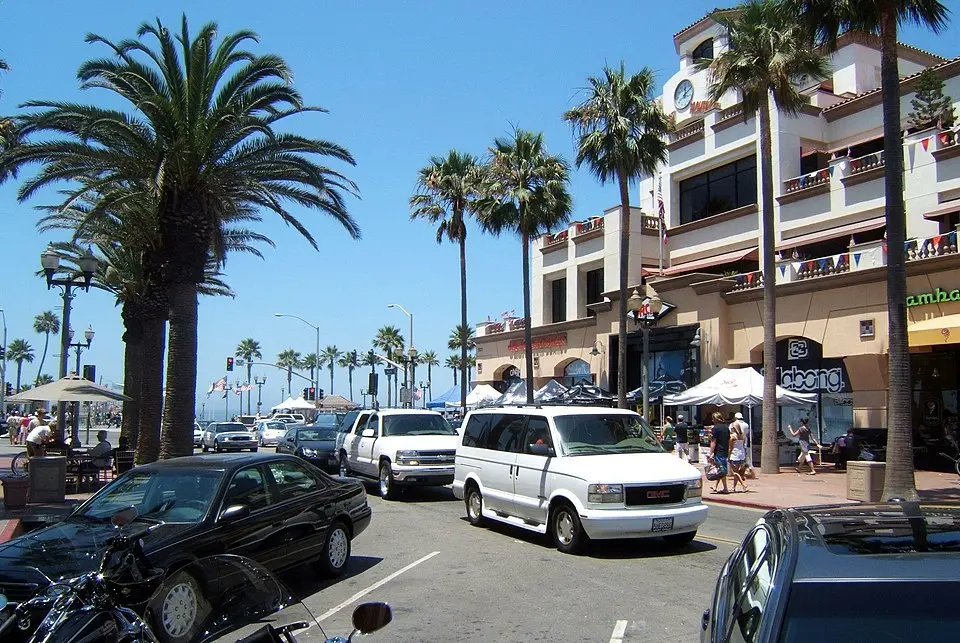
About Huntington Beach, CA
Huntington Beach, "Surf City, USA," stretches along the Pacific, a vibrant Orange County city with a significant tourist draw. Its lengthy pier and consistent waves attract a youthful, active population. With a safety score of 35/100 and a population coverage of 190,081, Huntington Beach has a total crime rate of 2,196.4 per 100,000 residents.