 Violent
Property
Total
Violent
Property
Total
Quick answer
According to crimebycity.com's analysis of FBI 2024 crime data, Wallingford, CT has a Safety Score of 93/100 — safer than 93% of US cities — with a total crime rate of 468.3 per 100,000 residents, ranking #206 of 2,971 US cities and #10 of 83 in Connecticut.
Safety Score
Violent Crime Rate
Property Crime Rate
Is Wallingford, Connecticut Safe?
Wallingford, Connecticut, a town of 45,000 residents, was established in 1670. It's known for its historic silver industry and is geographically situated in south-central Connecticut.
Wallingford has a safety score of 93/100 (Safer Than Average). Based on FBI data for 2024, the city reported a total crime rate of 468.3 per 100,000 residents, compared to the national average of 2,752.3 per 100,000.
Wallingford ranks #10 out of 83 cities in Connecticut and #206 out of 2971 nationally (safest first). This places it in the 93rd percentile for safety — safer than 93% of US cities.
All major crime categories in Wallingford are below the national average, with rape particularly low at 0.0x the national rate.
Year over year, Wallingford's total crime rate decreased by 3.5%, with violent crime rising 101.6%.
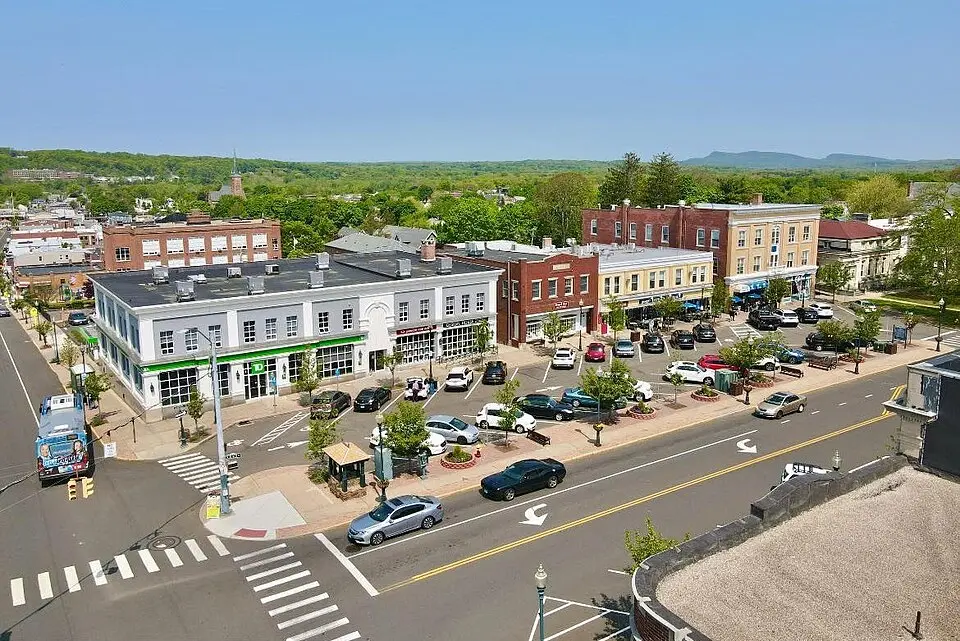
Photo: Wikimedia Commons
Wallingford Crime Statistics Breakdown (2024)
| Crime Type | Incidents | Rate per 100K | National Avg |
|---|---|---|---|
| Violent Crime | 8 | 18.4 | 473.3 |
| Murder | 2 | 4.6 | 6.2 |
| Rape | 0 | 0.0 | 43.4 |
| Robbery | 1 | 2.3 | 93.0 |
| Aggravated Assault | 5 | 11.5 | 330.0 |
| Property Crime | 196 | 449.9 | 2,279.1 |
| Burglary | 11 | 25.3 | 287.8 |
| Larceny-Theft | 172 | 394.9 | 1,638.9 |
| Motor Vehicle Theft | 13 | 29.8 | 352.4 |
| Arson | 0 | 0.0 | 0.0 |
Wallingford vs Connecticut Average
How does Wallingford's crime rate compare to the Connecticut state average?
| Metric | Wallingford | Connecticut Avg | Difference |
|---|---|---|---|
| Violent Crime Rate | 18.4 | 159.2 | -88.5% |
| Property Crime Rate | 449.9 | 1,586.4 | -71.6% |
| Murder Rate | 4.6 | 2.7 | +68.8% |
| Total Crime Rate | 468.3 | 1,745.6 | -73.2% |
Wallingford Crime Rate Trends
Year-over-year crime rate changes for Wallingford, Connecticut.
| Year | Coverage | Total Crime Rate | Violent Crime Rate | Property Crime Rate |
|---|---|---|---|---|
| 2024 | 43,561 | 468.3 | 18.4 | 449.9 |
| 2023 | 43,902 | 485.2 | 9.1 | 476.1 |
| 2022 | 44,099 | 655.3 | 18.1 | 637.2 |
| 2021 | 43,969 | 680.0 | 34.1 | 645.9 |
| 2020 | 44,236 | 770.9 | 58.8 | 712.1 |
| 2019 | 44,457 | 695.1 | 40.5 | 654.6 |
Frequently Asked Questions
Is Wallingford, Connecticut safe?
Wallingford has a safety score of 93/100, meaning it has less crime than about 93% of US cities in our FBI dataset. With a total crime rate of 468.3 per 100,000 residents in 2024, Wallingford is relatively safe.
What is the crime rate in Wallingford, Connecticut?
According to FBI data for 2024, Wallingford has a violent crime rate of 18.4 per 100,000 and a property crime rate of 449.9 per 100,000 residents.
How does Wallingford compare to the national average?
Wallingford's total crime rate of 468.3 per 100,000 can be compared to the national average. The data covers 43,561 residents.
What types of crime are most common in Wallingford?
Based on FBI 2024 data, the most reported crimes in Wallingford include larceny-theft, aggravated assault, and burglary. Property crime is generally more common than violent crime.
Is Wallingford safe to visit?
Like any city, Wallingford has areas that are safer than others. The city's overall safety score is 93/100 based on FBI crime data. Standard travel precautions are recommended.