 Violent
 Property
Total
Property
Total
Quick answer
According to crimebycity.com's analysis of FBI 2024 crime data, Arlington, MA has a Safety Score of 92/100 — safer than 92% of US cities — with a total crime rate of 489.8 per 100,000 residents, ranking #231 of 2,971 US cities and #46 of 186 in Massachusetts.
Safety Score
Violent Crime Rate
Property Crime Rate
Is Arlington, Massachusetts Safe?
Arlington, MA, a historic suburb northwest of Boston, was once home to Uncle Sam. This densely populated town of over 46,000 residents features a mix of residential areas and commercial centers along Massachusetts Avenue.
Arlington has a safety score of 92/100 (Safer Than Average). Based on FBI data for 2024, the city reported a total crime rate of 489.8 per 100,000 residents, compared to the national average of 2,752.3 per 100,000.
Arlington ranks #46 out of 186 cities in Massachusetts and #231 out of 2971 nationally (safest first). This places it in the 92nd percentile for safety — safer than 92% of US cities.
All major crime categories in Arlington are below the national average, with murder particularly low at 0.0x the national rate.
Year over year, Arlington's total crime rate decreased by 12.2%, with violent crime declining 42.9%.
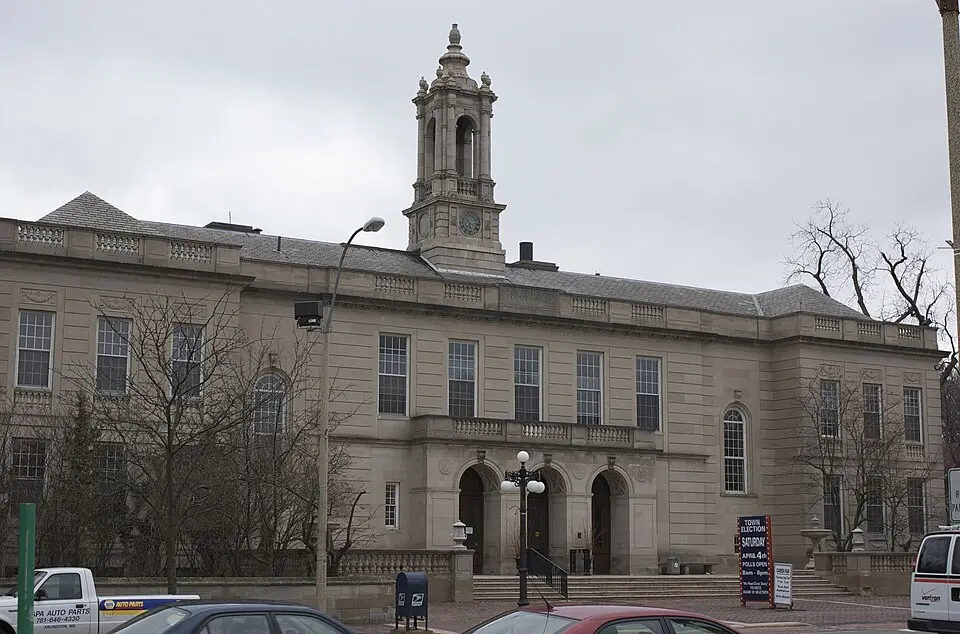
Photo: Wikimedia Commons
Arlington Crime Statistics Breakdown (2024)
| Crime Type | Incidents | Rate per 100K | National Avg |
|---|---|---|---|
| Violent Crime | 26 | 55.4 | 473.3 |
| Murder | 0 | 0.0 | 6.2 |
| Rape | 5 | 10.7 | 43.4 |
| Robbery | 0 | 0.0 | 93.0 |
| Aggravated Assault | 21 | 44.7 | 330.0 |
| Property Crime | 204 | 434.5 | 2,279.1 |
| Burglary | 28 | 59.6 | 287.8 |
| Larceny-Theft | 159 | 338.6 | 1,638.9 |
| Motor Vehicle Theft | 17 | 36.2 | 352.4 |
| Arson | 0 | 0.0 | 0.0 |
Arlington vs Massachusetts Average
How does Arlington's crime rate compare to the Massachusetts state average?
| Metric | Arlington | Massachusetts Avg | Difference |
|---|---|---|---|
| Violent Crime Rate | 55.4 | 312.0 | -82.3% |
| Property Crime Rate | 434.5 | 1,086.7 | -60.0% |
| Murder Rate | 0.0 | 2.0 | -100.0% |
| Total Crime Rate | 489.8 | 1,398.7 | -65.0% |
Arlington Crime Rate Trends
Year-over-year crime rate changes for Arlington, Massachusetts.
| Year | Coverage | Total Crime Rate | Violent Crime Rate | Property Crime Rate |
|---|---|---|---|---|
| 2024 | 46,956 | 489.8 | 55.4 | 434.5 |
| 2023 | 45,365 | 557.7 | 97.0 | 460.7 |
| 2022 | 45,238 | 610.1 | 55.3 | 554.8 |
| 2021 | 45,767 | 336.5 | 41.5 | 295.0 |
| 2020 | 45,582 | 346.6 | 57.0 | 289.6 |
| 2019 | 45,614 | 440.7 | 74.5 | 366.1 |
Frequently Asked Questions
Is Arlington, Massachusetts safe?
Arlington has a safety score of 92/100, meaning it has less crime than about 92% of US cities in our FBI dataset. With a total crime rate of 489.8 per 100,000 residents in 2024, Arlington is relatively safe.
What is the crime rate in Arlington, Massachusetts?
According to FBI data for 2024, Arlington has a violent crime rate of 55.4 per 100,000 and a property crime rate of 434.5 per 100,000 residents.
How does Arlington compare to the national average?
Arlington's total crime rate of 489.8 per 100,000 can be compared to the national average. The data covers 46,956 residents.
What types of crime are most common in Arlington?
Based on FBI 2024 data, the most reported crimes in Arlington include larceny-theft, aggravated assault, and burglary. Property crime is generally more common than violent crime.
Is Arlington safe to visit?
Like any city, Arlington has areas that are safer than others. The city's overall safety score is 92/100 based on FBI crime data. Standard travel precautions are recommended.