 Violent
 Property
 Total
Total
Quick answer
According to crimebycity.com's analysis of FBI 2024 crime data, Fall River, MA has a Safety Score of 37/100 — higher crime than 63% of US cities — with a total crime rate of 2,136.6 per 100,000 residents, ranking #1,882 of 2,971 US cities and #176 of 186 in Massachusetts.
Safety Score
Violent Crime Rate
Property Crime Rate
Is Fall River, Massachusetts Safe?
Fall River, site of the infamous Lizzie Borden case, is a South Coast Massachusetts city nestled along the Taunton River. Once a major textile center, its population is now largely working-class, with a significant Portuguese heritage.
Fall River has a safety score of 37/100 (Higher Crime Than Average). Based on FBI data for 2024, the city reported a total crime rate of 2,136.6 per 100,000 residents, compared to the national average of 2,752.3 per 100,000.
Fall River ranks #176 out of 186 cities in Massachusetts and #1882 out of 2971 nationally (safest first). This places it in the 37th percentile for safety — with higher crime than 63% of US cities.
The most elevated crime category in Fall River is aggravated assault, at 578.6 per 100K — 1.8x the national average. Conversely, motor vehicle theft is relatively low at just 0.5x the national rate.
Year over year, Fall River's total crime rate decreased by 8.6%, with violent crime declining 18.1%.
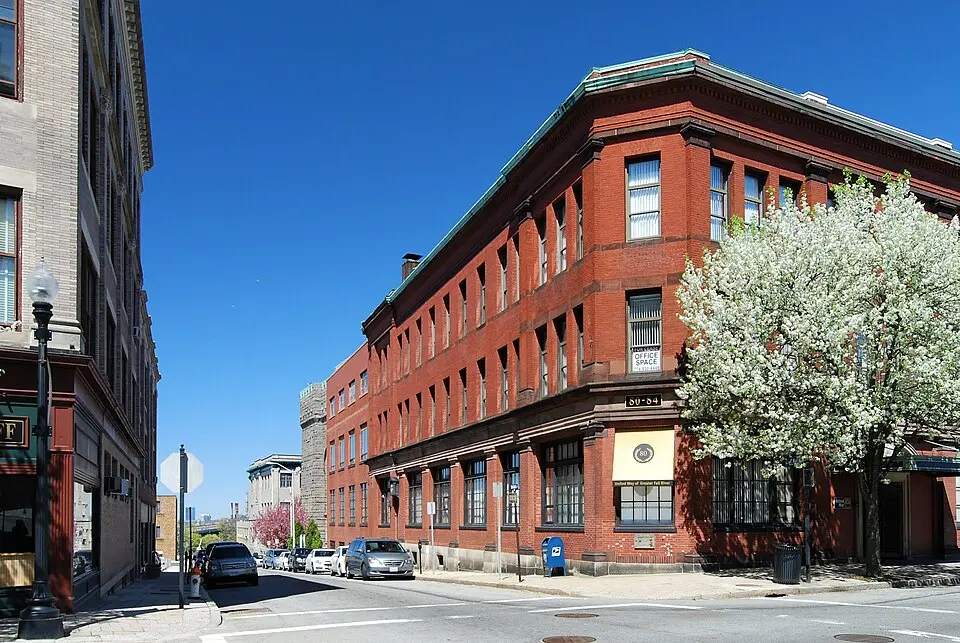
Photo: Wikimedia Commons
Fall River Crime Statistics Breakdown (2024)
| Crime Type | Incidents | Rate per 100K | National Avg |
|---|---|---|---|
| Violent Crime | 712 | 745.0 | 473.3 |
| Murder | 3 | 3.1 | 6.2 |
| Rape | 58 | 60.7 | 43.4 |
| Robbery | 96 | 100.5 | 93.0 |
| Aggravated Assault | 553 | 578.6 | 330.0 |
| Property Crime | 1,330 | 1,391.6 | 2,279.1 |
| Burglary | 221 | 231.2 | 287.8 |
| Larceny-Theft | 952 | 996.1 | 1,638.9 |
| Motor Vehicle Theft | 157 | 164.3 | 352.4 |
| Arson | 0 | 0.0 | 0.0 |
Fall River vs Massachusetts Average
How does Fall River's crime rate compare to the Massachusetts state average?
| Metric | Fall River | Massachusetts Avg | Difference |
|---|---|---|---|
| Violent Crime Rate | 745.0 | 312.0 | +138.8% |
| Property Crime Rate | 1,391.6 | 1,086.7 | +28.1% |
| Murder Rate | 3.1 | 2.0 | +58.6% |
| Total Crime Rate | 2,136.6 | 1,398.7 | +52.8% |
Fall River Crime Rate Trends
Year-over-year crime rate changes for Fall River, Massachusetts.
| Year | Coverage | Total Crime Rate | Violent Crime Rate | Property Crime Rate |
|---|---|---|---|---|
| 2024 | 95,573 | 2,136.6 | 745.0 | 1,391.6 |
| 2023 | 93,879 | 2,337.1 | 909.7 | 1,427.4 |
| 2022 | 94,339 | 2,237.7 | 1,003.8 | 1,233.9 |
| 2021 | 90,618 | 1,988.6 | 959.0 | 1,029.6 |
| 2020 | 89,136 | 1,992.5 | 876.2 | 1,116.3 |
| 2019 | 89,066 | 2,073.7 | 867.9 | 1,205.9 |
Frequently Asked Questions
Is Fall River, Massachusetts safe?
Fall River has a safety score of 37/100, meaning it has less crime than about 37% of US cities in our FBI dataset. With a total crime rate of 2,136.6 per 100,000 residents in 2024, Fall River is higher-crime than most US cities.
What is the crime rate in Fall River, Massachusetts?
According to FBI data for 2024, Fall River has a violent crime rate of 745.0 per 100,000 and a property crime rate of 1,391.6 per 100,000 residents.
How does Fall River compare to the national average?
Fall River's total crime rate of 2,136.6 per 100,000 can be compared to the national average. The data covers 95,573 residents.
What types of crime are most common in Fall River?
Based on FBI 2024 data, the most reported crimes in Fall River include larceny-theft, aggravated assault, and burglary. Property crime is generally more common than violent crime.
Is Fall River safe to visit?
Like any city, Fall River has areas that are safer than others. The city's overall safety score is 37/100 based on FBI crime data. Standard travel precautions are recommended.